


CallCabinet User Guide
Installation
CallCabinet is simple to install and, in the majority of cases, is integrated with a PBX, switch or network. All that is required is for it to be activated. To activate CallCabinet, a Customer ID and Site ID is required, which will be created through the registration process. CallCabinet seamlessly integrates with all major unified communications (UC), IP-PBX and telephony platforms. Please speak to your distributor or reseller about the options available, or contact CallCabinet directly at support.callcabinet.com.
Registration
Registering on CallCabinet is simple. You should have received an email directly from CallCabinet or your certified CallCabinet partner. Open this email and then click on the provided link which will direct you to CallCabinet’s account registration page, newaccount.callcabinet.com/Account/Register. Once you land on this page, it will look similar to Figure – Register Account. Continue with the registration by entering information into the blank fields:
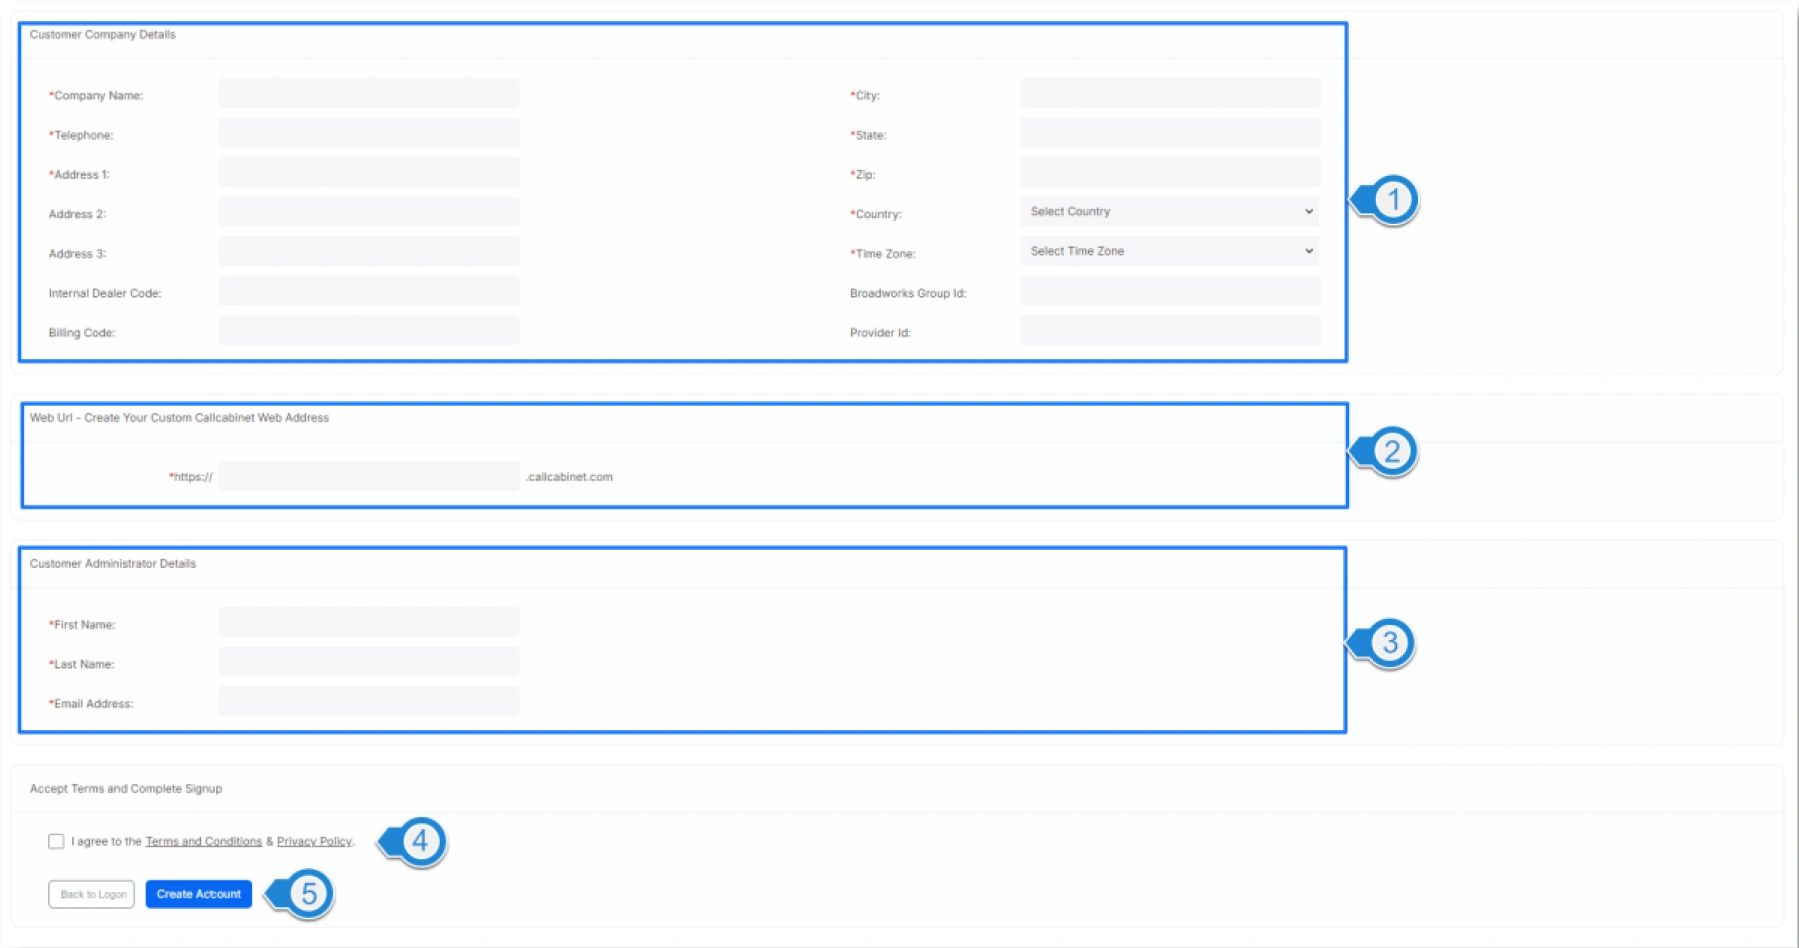
Figure – Register Account
The numbers in the discussion below relate to Figure – Register Account:
- Complete Company Details section by entering your company’s information such as its name and address.
- Create your own unique CallCabinet WEB URL address. This URL will be used to access your customized login page. For instance, if your company’s name is ‘Wayne Enterprises’, your URL would be something like https://wayneenterprises.callcabinet.com. Incidentally, when you type the company’s name in the Company Name field, CallCabinet will automatically use this name, with no spaces as the default URL, which you may change as necessary. NOTE: It is important you remember this URL as it is the only way you will be able to log into your CallCabinet account.
- Complete the Administrator Details section for the initial administrator of your account. It is imperative that the email address entered is valid and existing. If this is not the case, the administrator of your account will not be able to be activated. NOTE: This information may be changed once the initial login is complete. Incidentally, once you have successfully logged into the CallCabinet, you will be able to add additional users and administrators in the Settings section under the User Management. This process is discussed in more detail under the User Management section.
- To complete the registration process, you need to check the I agree to the Terms and Conditions and Privacy Policy check box.
- After you have entered and checked all the required information, click the Create My Account button to complete registration. You will receive an email to verify your email address.
Once you have verified your email address, you will receive a second email, which is a confirmation email, similar to that illustrated in Figure – Registration Successful. This will contain your Customer ID and Customer (Company) Name, Site ID, and the Site Name. Once you have received this confirmation, you can proceed to your personalized login page. Remember, you can only login to your company’s personalized login page.
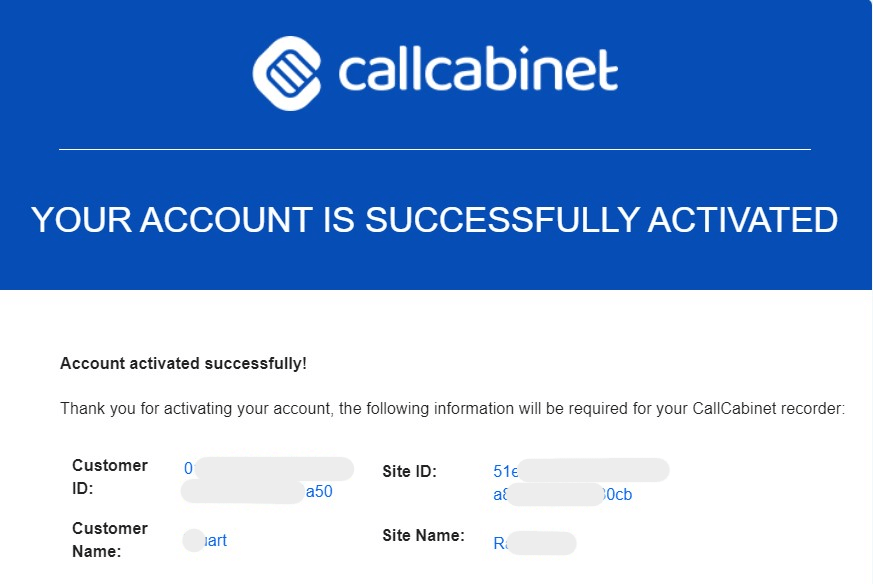
Figure – Registration Successful
Login Page
Once registration is complete, a user may log into their account by means of CallCabinet’s SAAS application. The user would proceed to CallCabinet’s login page by entering the company’s personalized URL.
By doing so they should land on a page similar to that illustrated in Figure – Login Page.
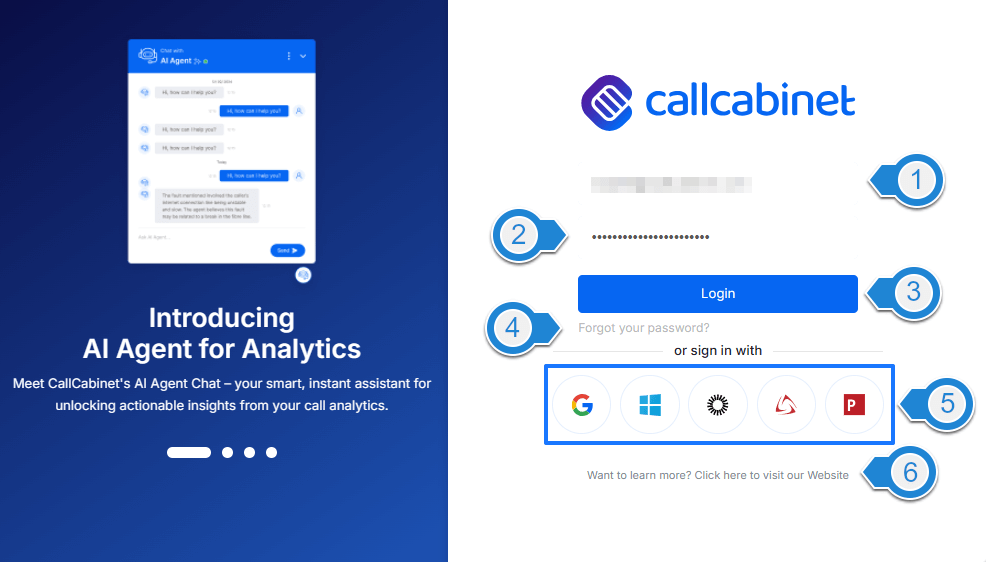
Figure – Login Page
The numbers in the discussion below relate to the image in Figure – Login Page. To login, the user would proceed by:
- Entering their email address used during registration OR proceed to step 5 if the user has a Gmail, Microsoft or Okta username that matches the email address they were registered with.
- Entering their password created during registration.
- Click Login. If the user’s login profile requires Two Factor Authentication, then they will be required to enter in the one-time password sent to their email address, or if using a two-factor authentication application, enter the code the application generates into the one-time password field that is rendered on their login page.
- Should a user have forgotten their password, they would click Forgot your Password. On the screen that appears, which will be similar to that illustrated in Figure – Forgot Password,
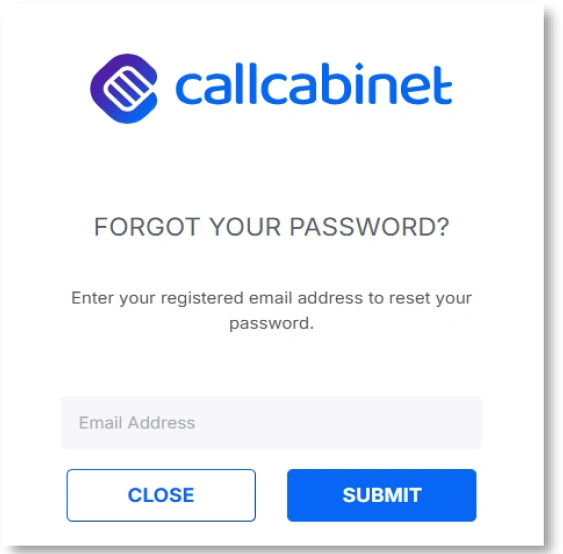
Figure – Forgot Password
- the user enters their email address and then clicks Submit. A temporary password will be sent to their email.
NOTE: Once a user has gained access to their account, they must create a new password to replace the temporary password they were sent. - If the user has a Gmail, Google Apps, Windows Azure or Okta username that matches their email address used when registering and supports SSO Federation Login, they can click the corresponding icon.
- If you do not have an account or want to learn more, visit CallCabinet’s website, https://www.callcabinet.com.
Should authentication be successful, the user will be granted access to their CallCabinet account.
The Homepage
When a user successfully logs in to their account, they will be presented with a home screen similar to that illustrated in Figure – Default Homepage. This is the default screen and is a convenience dashboard exposing certain metrics of the user’s account. This page may be changed or disabled to meet the user’s preferences.

Figure – Default Homepage
The account into which the user logs in, is displayed in the ‘company dropdown’ list indicated by 2 in Figure – Default Homepage. Should the email address the user uses to log in to CallCabinet be associated with more than one company, then the user may click on the dropdown indicated by 2 in Figure – Default Homepage and select the company they want to work with by clicking on that company’s name. An example of this is:

As can be seen, a user is able to switch between the different companies associated with their email once they have successfully logged in to any one of the companies. Incidentally, a user may search for a company by entering the value in the search field represented by the magnifying glass  , for example

The numbers in the discussion below relate to the image in Figure – Default Homepage which describe each function on the homepage.
- Home Page icon indicates that the user is viewing the home page by being highlighted. Incidentally, pressing the menu item Home, currently highlighted in the menu bar, will direct the user to this home page.
- The Company: If the logged in user’s email is associated with more than one company (synonymous with ‘customer’), they will be able to switch between each of them by clicking on the drop-down list and selecting the one required, as discussed earlier.
- The CallCabinet Menu Bar is positioned vertically, on the left-hand side of the view and allows site-wide navigation to all CallCabinet’s pages. A user may easily identify an icon by hovering over each of them. A tooltip, which pops-up, will identify the process the icon is associated with, for example;

Each of these menu items will be discussed, in detail, throughout this document. - The Profile drop-down list allows the logged in user to:
-
- View the current CallCabinet account they have logged in to.
- View the name of the currently logged in user and their email address (greyed out in the image).
- Change the user’s preferred language. The following languages are supported:
- Ukrainian
- English
- Chinese
- Hebrew
- Spanish
- Afrikaans
- Indonesian
- Portuguese
- German
- French
- Greek
- Hindi
- Polish
- Japanese
- Dutch
- Korean
- Swedish
- Russian
- Select the Multi-Function Authentication (MFA) method, if required.
- Reset the logged in user’s password.
- Log out of CallCabinet.
An example of this drop-down menu is illustrated in Figure – Profile Options.
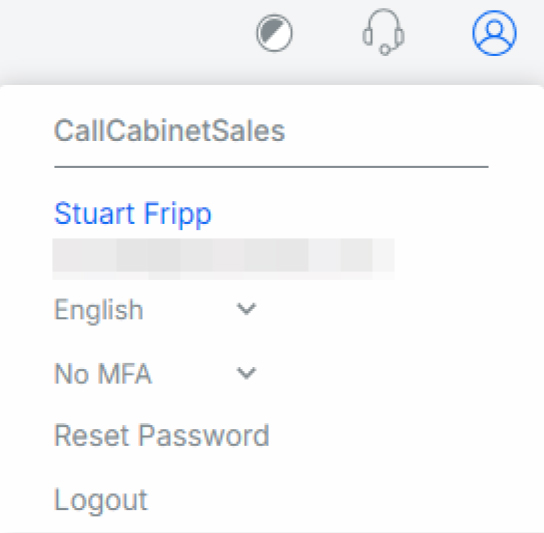
Figure – Profile Options
- The Support dropdown list. A user may log a support ticket by clicking on the Support Portal item. Depending upon the account’s configuration the user will be directed either to a URL where they may log a ticket, or their email client will be opened into which they may enter their request and send it to the auto populated recipient’s address. The user may also access CallCabinet’s online User Guide (this document) by clicking on the CallCabinet User Guide item.

- A user may change the look-and-feel theme of the application. Currently, there are five available options.
-
- Light: Displays the interface with a light background and dark text.
- Dark: Displays the interface with a dark background and light text.
- System: Matches the theme of your operating system automatically.
- Light Contrast: Displays a light background with higher contrast for improved readability.
- Dark Contrast: Displays a dark background with higher contrast for improved readability.

The theme that is being used in the screen shots within this document is the Light theme. As an example, selecting the Dark theme will change the look-and-feel to the following;

Adjusting the Display Size: You can Zoom in or out to improve readability and meet accessibility needs.- Click the plus (+) icon to increase the zoom level.
- Click the minus (–) icon to decrease the zoom level.
- The current zoom level is displayed between the icons (for example, 100%).
The content layout adjusts automatically to ensure that no information is lost and all functions remain accessible. Text can also be resized up to 200 percent without loss of functionality, in compliance with the EU Accessibility Act 2025.
-
- Calls Counter widget (or tile/card) displays metrics relating to the number of calls the selected company has recorded over the Last Hour, Calls Today, Calls This Week, Calls Last Week as well as the Total Calls recorded for the account. The metric This Month indicates the percentage change in call volume from the previous month at the same stage of the month.
- Call Volume widget (or tile/card) displays the volume of calls recorded for this account by CallCabinet over the past 14 days, 4 weeks or last 6 months. The default is the last 14 days.
- The Call Volume’s Date Range that may be selected, which may be the Last 14 days, Last 4 weeks or Last 6 months.
- User Activity widget (or tile/card) provides metrics on the number of Logins, Calls Played Back and Quality Assurances (QA) completed by the displayed users during the last 14 days, last month or last 6 months. These metrics are displayed in different colors as indicated by the key in the User Activity Should a user hover their cursor over any part of the different colors on the bar associated with a particular user, a tooltip appears containing the metric’s name and associated value. For example;
- The User Activity Date Range that may be selected, which may be the Last 14 days, Last Month or Last 6 Months.

- Security Logs widget (or tile/card) displays a record of the most recent user login occurrences to the selected account. This widget will only be visible for users with the appropriate role. For instance, Super Admin, Admin and Support User. Clicking on View User will navigate the user to a log page in which all the selected user’s activity will be displayed. Incidentally, far more detailed information is available on the Security Log page, which will be discussed later in this document.
- Show this Page at Login is ticked by default. Upon login, if this checkbox is un-ticked/un-checked, the user will be directed to the Call Listing Page. NOTE: Should a user not have permission to access the Call Listing Page, they will be directed to the default Homepage, which will look similar to that in Figure – Default Homepage. This is a global setting for all the company’s account
- Portal Selection Depending upon the logged in user’s role, permissions and licenses these tabs become visible and provide quick access to the various ‘portals’ of CallCabinet. For instance, clicking on the Analytics tab will navigate the user to the Conversation Analytics portal. Likewise, should the user be a partner user, the Partner portal will be visible, allowing that user to navigate to the partner portal when its tab is clicked. The Recording tab is the customer portal.
The CallCabinet menu is always available on the left-hand side of the application’s screen and is abbreviated with icons. All the user’s options are illustrated in Figure – CallCabinet’s User’s Menu Options.
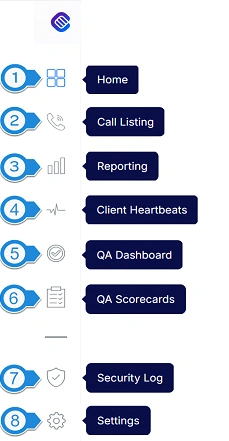
Figure – CallCabinet’s User’s Menu Options
The numbers below relate to the image in Figure – CallCabinet’s User’s Menu Options and provide a brief explanation of each menu item. Each item is discussed in more detail further on in this document. The menu may be separated into two sections, the end user section which relates to items 1 through 6, inclusive and the admin section which relates to items 7 and 8.
- Clicking on Home directs a user to The Homepage, where the user can view certain dashboard information widgets, inter-alia call volume, security alerts, call counter and call statistics widgets.
- Clicking on Call Listing directs a user to the Call Listing page, where the user may view, filter, tag, search for words and phrases and playback calls. With the bulk functions a user is able to perform actions on multiple calls. For instance, placing a legal hold on multiple (bulk) calls. It is likely users will spend most of their time on this page.
- Clicking on Reporting directs a user to the Reporting page, where the user may pull reports such as, Call Duration, Call Volume, Quality Assurance and Speech Analytics. A license is required to access this page.
- Clicking on Client Heartbeats directs a user to the Client Heartbeats page, where the user can view the number of CallCabinet Agent Client Desktop and CallCabinet Desktop Recorder installs.
- Clicking on QA Dashboard directs a user to the Quality Assurance Dashboard page, where the user can view information such as the number of QA’s completed and QA score averages. The user may perform a QA evaluation using the QA Randomizer directly from this page and view any historical QAs completed.
- Clicking on QA Scorecards directs a user to the Quality Assurance Scorecard Management page, where the user can create, edit and delete QA Scorecards
- Clicking on Security Log directs a user to the Security Log page where the user can view a complete history of actions performed on the account by all users.
- Clicking on the Settings menu item renders a sub-menu of administrative functions.
Settings Sub-Menu
Settings opens up a separate sub-menu. This sub-menu is the area in which an account’s administrator performs all administrative tasks. The default screen that is rendered when clicking on Setting is the General view. The numbers below relate to those in Figure – Settings sub-menu.
- Clicking on General directs a user to a page allowing the user to configure Company Information and Security Settings. These settings govern the customer’s entire CallCabinet account and are applied to every registered user within the organization. This view is divided up into five separate tabs.
- Clicking on User Management directs a user to the User Management page where the user, with the requisite authority can add, edit or delete a user’s profile.
- Clicking on Custom User Roles directs a user to the Custom User Roles page where the user, with the requisite authority can create, edit or delete a custom role.
- Clicking on Restricted User Roles directs a user to the Restricted User Roles page where the user, with the requisite authority is able to restrict users either by agent, group or site.
- Clicking on Site Management directs a user to the Site Management page where the user, with the requisite authority can add, edit or delete sites.
- Clicking on Agent Management directs a user to the Agent Management page, where the user, with the requisite authority can add, edit or delete agents.
- Clicking on Assign Agents directs a user to the Assign Agents page, where the user can assign agents to extensions.
- Clicking on Agent Groups directs a user to the Agent Groups page, where the user, with the requisite authority can create, edit or delete groups.
- Clicking on Extension Management directs a user to the Extension Management page, where the user, with the requisite authority can create, edit or delete extensions.
- Clicking on Call Tags directs a user to the Call Tags page, where the user, with the requisite authority can create, edit or delete call tags.
- Clicking on QA Randomizer directs a user to the QA Randomizer page, where the user, with the requisite authority can manage and define parameters that restrict the QA randomizer.
- Clicking on Retention Policy directs a user to the Retention Policy page, where the user, with the requisite authority can define the retention policy per site.
- Clicking on Notifications directs a user to the Notifications page, where the user, with the requisite authority can create notification rules.
- Clicking on Grid Management directs a user to the Grid Management page, where a user may manage the column view on the Call Listing page.
- Clicking on Ip WhiteList directs a user to the IP WhiteList page, where the user, with the requisite authority can restrict user access to a predefined publicly accessible IP address.
- Clicking on Phonebook directs a user to the Phonebook page, where a user is able to create, edit or delete phonebook entries.
- A user may search for a settings menu item by clicking in the Search Settings field and typing in the menu item they desire. As the user types, any item that matches will be rendered in a selectable list.
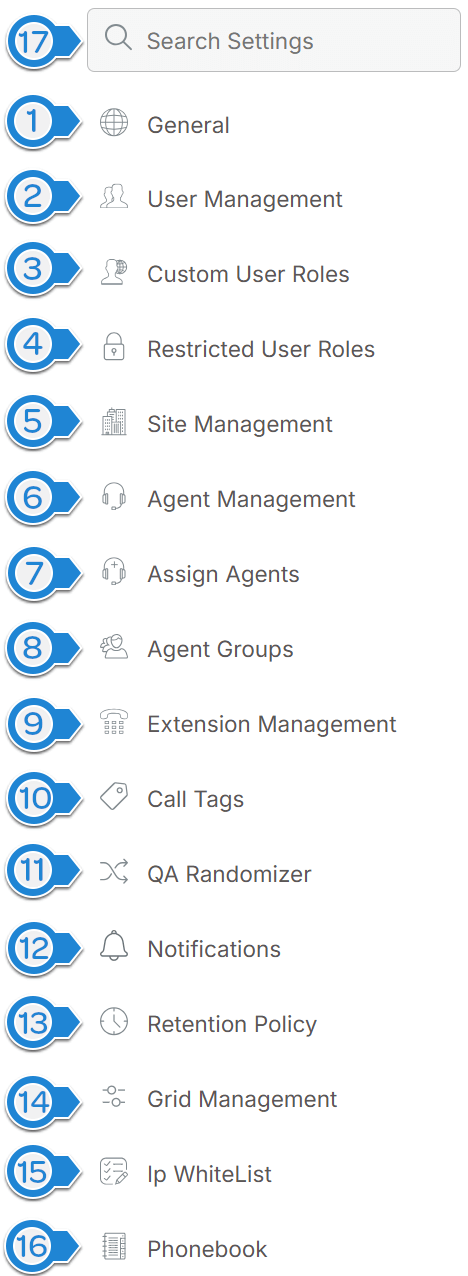
Figure – Settings sub-menu
Call Listing Page

Figure – Call Listing Page
The Call Listing page is where a user may search for, download and playback calls currently stored in the CallCabinet’s system. Users will generally spend most of their time using this feature of CallCabinet.
When the call listing page is rendered, it will look similar to Figure – Call Listing page if the logged in user has the appropriate permissions. The image illustrates the basic features of the Call Listing page. The numbers in the discussion that follows, relate to the numbers in Figure – Call Listing Page.
- The Audio Player also called the ‘transport bar’ allows a user to play and pause a selected call recording. By highlighting the row of the call recording and clicking the right-facing arrow > on the player opens the audio oscillogram, also called an audio wave. The ‘bars’ above the horizontal line represents one speaker’s audio, whilst those below represent the other. A red block within the oscillogram indicates PCI redaction. An example of this oscillogram is:
 A user can navigate directly to locations in the timeline by clicking inside the oscillogram. Pressing the left-facing arrow < will close the oscillogram. Pressing the information icon
  will display various metadata about the call. For example:
- The Add Filter feature allows a user to filter the Call Data Table (number 4) based on selected parameters including; date range, call duration, extension, agent, group, site or call tag.
- The Apply button, once clicked, applies the selected filter option where the results of the applied filters are listed in the Call Data Table, indicated by number 4 in Figure – Call Listing Page. Please be aware that any filters a user configures only come into effect once the user presses the Apply button.
- The Call Listing Data Table displays a single row for each call recording. Calls displayed in this table are those that match the filters applied, as described in 2 and 3 above. Further filtering can be applied by clicking on the ‘filter funnel icon’
 adjacent to the column heading the user is wanting to apply the filter.
NOTE: The default column filter option is Starts With, which helps users quickly narrow down results based on values that begin with the entered characters. This filter is applicable only to text-based columns. For non-text columns such as dates or durations, the default filter does not apply. - The search transcripts button,
 . Clicking on this will render a card in which the logged in user may search for word and word phrases that may occur in any of the calls that have been transcribed in the Call Listing Data Table. This feature is discussed in detail further on in this document.
 - This is the Bulk Actions Toolbar where a user may perform bulk (multiple) actions such as downloading
 , deleting
  , exporting to Excel
  , compliant call sharing
  , email
  and the ability to place a legal hold
  on more than one call recording at a time.
 - The Items Per Page drop-down arrow lists the number of calls to display, at a time in the Call Listing Data Table. The range is from 25 – 10 000.
- This indicates the number of calls being displayed per page. The series of numbers to the left indicate the number of the page available to view.
- Edit columns allows a user to show or hide columns in the Call Listing Data Table (indicated by number 4 in Figure – Call Listing Page). See further explanation below.
- The Saved Filters button. Clicking on this will result in a dialog appearing from which you may select a filter that you have custom made, and apply to the Call Listing page to filter the calls based on the selected saved filter’s criteria.
- This is the global toolbar that is visible across all page views which was discussed under the Homepage section. However, there is an extra icon,
 in the call listing view and this is the time zone icon. By clicking on this icon, a user is able to set the time zone they would like to operate in. Clicking on the desired time zone will result in all the Call Listing table’s contents being adjusted accordingly. From this point on CallCabinet will reference the selected time zone. Should the user want to revert to their actual time zone, all they need to do is click on the ‘My Time Zone’ entry at the top of the time zone dropdown list, and the user’s time zone will be applied. An example of the dropdown rendered is;

Symbols and other meta-data
The numbers in the discussion below relate to the image in Figure – Call Listing Meta-Data
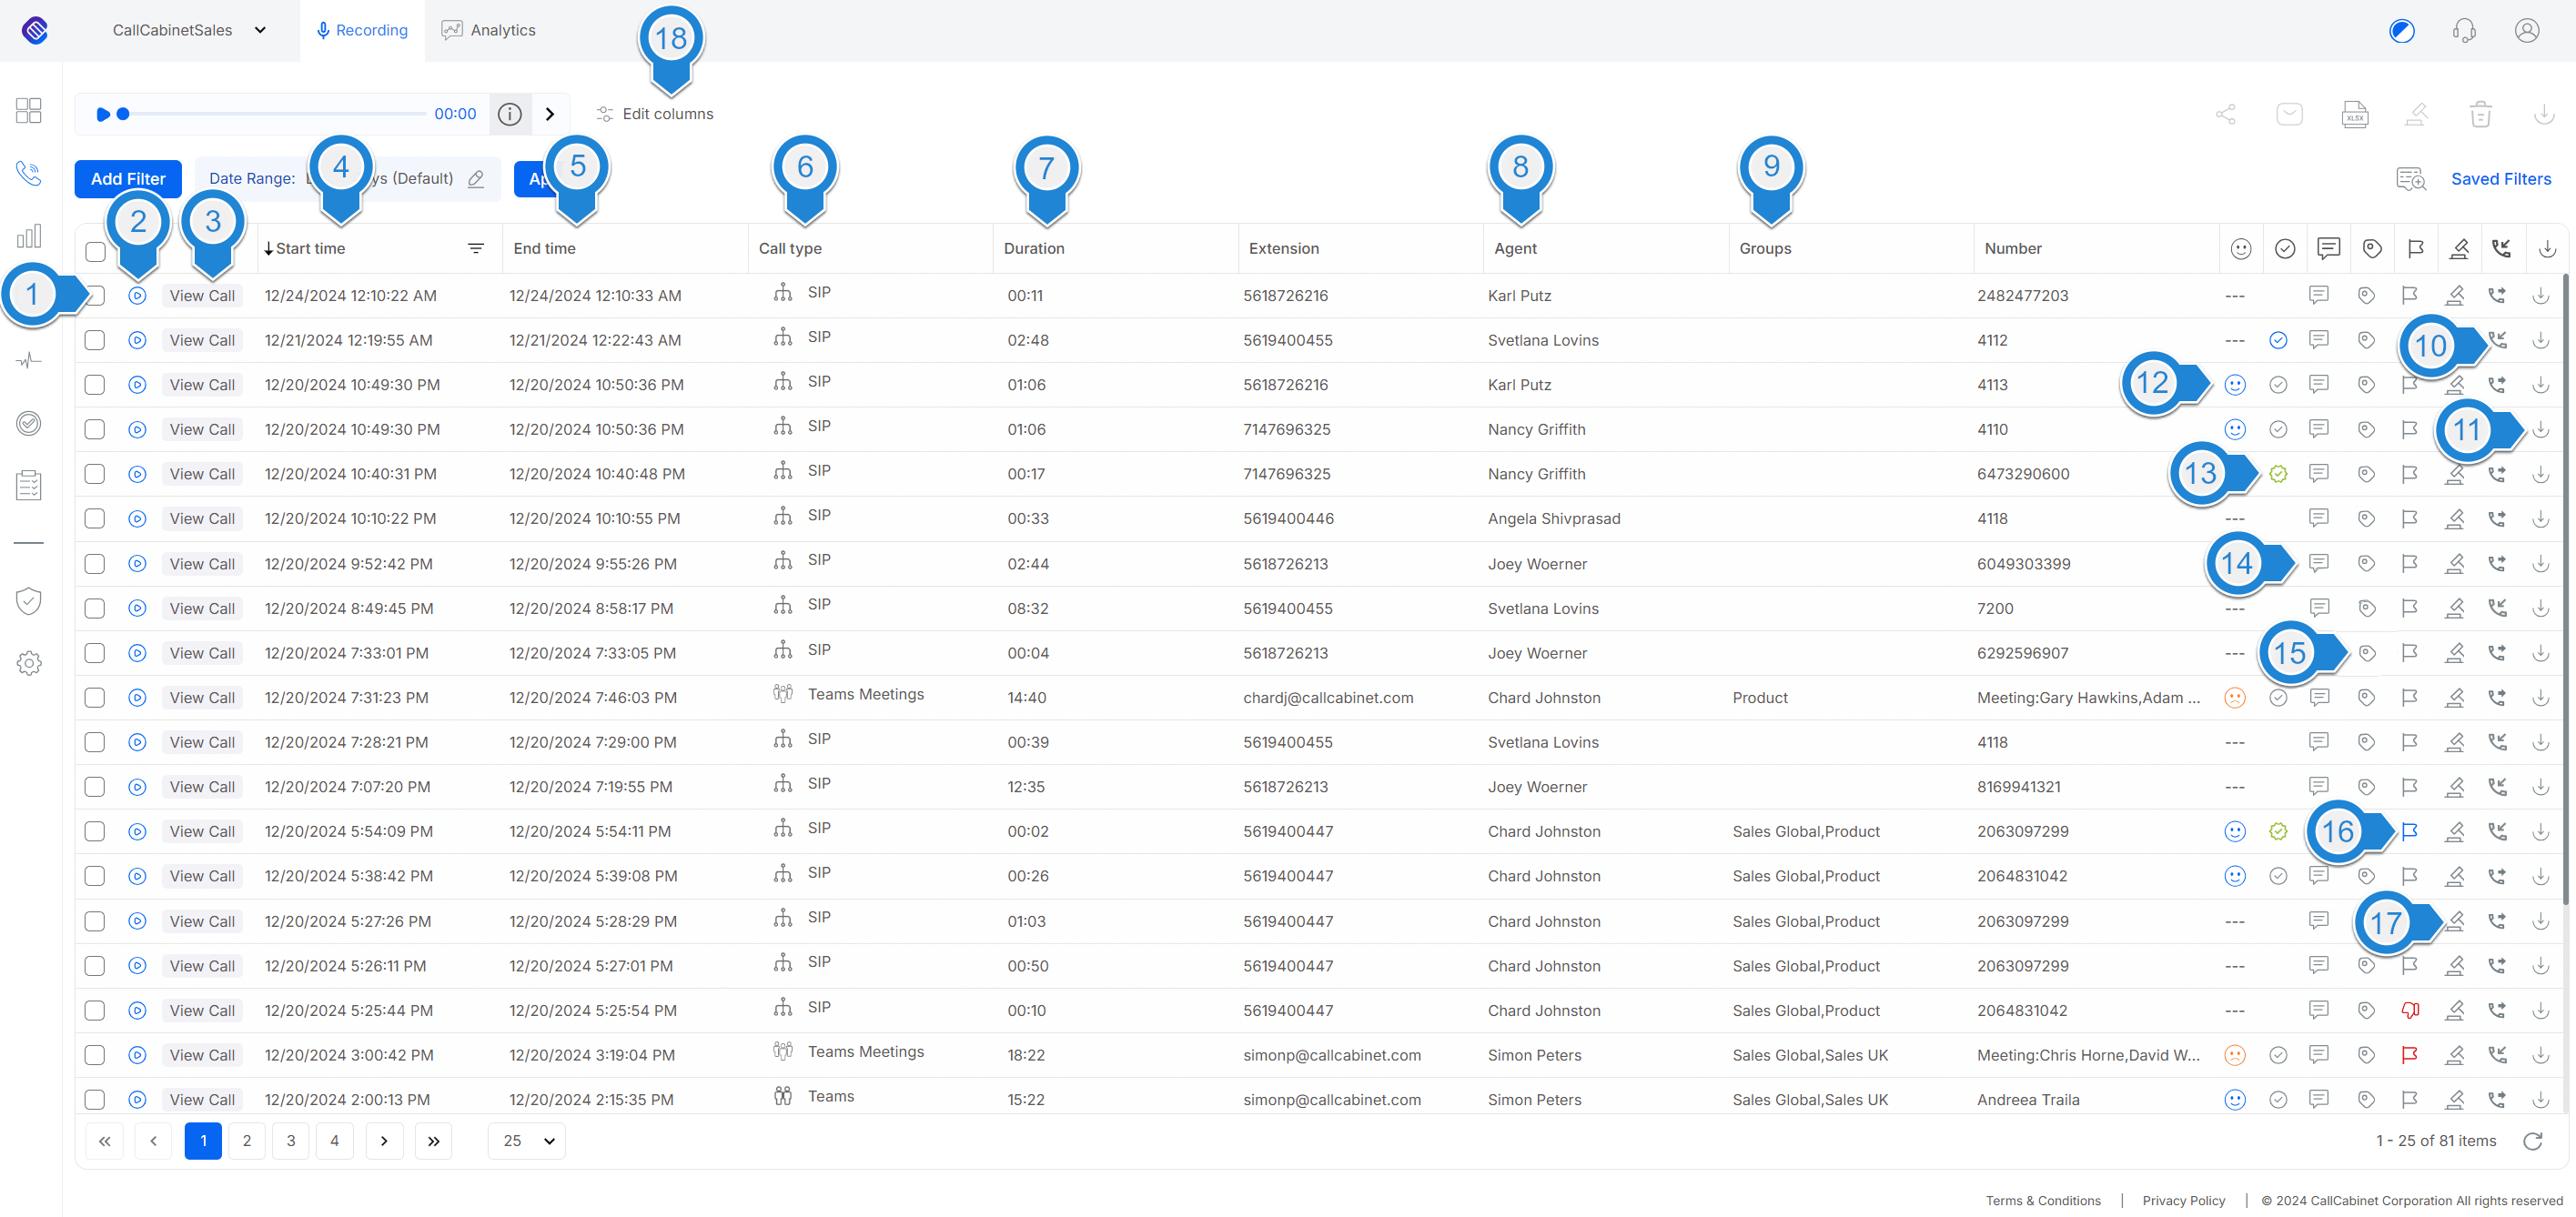
Figure- Call Listing Meta-Data
This discussion is an overview of the most common features in the Call Listing page. This page may contain many more columns displaying further call meta-data. The columns displayed and discussed here are the most common.
- 1. The Bulk check(tick) box; A call’s checkbox for bulk operations. By checking (ticking) the top-most box, all the call recordings are selected that appear in the Call Data Table. Should a user want to select individual calls, then the user would check each call’s individual checkbox associated on each line.
- The Play Audio
 button allows a user to listen to the audio of the selected recorded call.
 - The View Call Details
 button will direct the user to the Call Details page. This page is discussed in more detail under the Call Details page section.
 - Start Time informs the user the date and time the recording started.
- End Time informs the user the date and time the recording was completed.
- Call Type icon represents on which platform the call is being recorded. CallCabinet is able to record on many platforms, where each platform is represented by a symbol. For instance, the
 icon represents a normal phone call. The
  icon represents a Microsoft Teams recording, and the
  icon represents a SIP recording. The
  icon represents the Whats App recording. The
  icon represents the Whats App voice recording. Not only is the icon displayed, but the platform name is too.
 - Duration describes the length of the call, in mm:ss (minutes and seconds) format.
- The Agent column describes the agent who answered or made the call.
- The Groups column describes what group(s), if any, the agent is assigned to for a particular call.
NOTE: A user with an admin role may create groups under Settings > Agent Groups. - The Direction column indicates whether the call was incoming
 or outgoing
  .
. - The Download column allows the user to download a call in a non-encrypted format by clicking on the download icon associated with the call the user would like to download.
- The Call Sentiment icon indicates whether the call was negative , worsening
 , improving
  or positive in nature. This sentiment is evaluated automatically by CallCabinet.
 - QA Status column indicates whether QA has been performed against the call. If there is no icon, then no QA has been performed. However, if there is a blue circled tick
 , it indicates that manual QA has been performed against the call. If there is a grey circled tick
  , then automatic QA has been performed against the call. Should there be a green circled tick
  , then both manual and automatic QA has been performed against the call.
 - Call Transcription column contains an icon that when clicked will result in a transcription dialog being rendered. The logged in user may then request that the call be either transcribed or has CallCabinet’s AI generate a summary of the call, or both, by checking the relevant checkbox and pressing the go button.
 Once the process is complete the logged in user will be informed of this by means of an information banner appearing. The result of the call transcription may be viewed in the call’s detail page. The call details page is discussed in detail further on in this document. Incidentally, this is a value-add feature and does not require a license.
 - The call Tag
 symbol indicates that a call recording has been tagged with one or more tags.
 - The Flag symbols
 are entirely up to a company and its users’ interpretation and discretion. Any description that makes sense to the user may be assigned to each symbol. It is up to the company and users to ensure no ambiguity exists.
 - The Legal Hold symbol
 indicates that a legal hold has been placed on a call recording. Assigning a legal hold to a call means that the call is retained indefinitely, and overrides all the system’s call retention policy.
 - Edit Columns allows a user to change the columns visible and information displayed in the Call Data Table. Clicking on this button renders a pop-up similar to Figure – Column Selection. To add a column, simply drag the desired column name from Available Columns to Visible Columns. In the same manner, to delete a column, drag the column name from the Visible Columns to the Available Columns. When you return back to the call listing page the changes will have been applied. The columns associated with the ‘lock’ symbol may not be removed from or reordered in the Available Columns.
Other columns often selected by users to be visible in the Call Data Table are:
- Call ID which lists the unique encryption key associated with the call recording.
- Site refers to the site or location
- The call Note
 symbol indicates that a call recording has a note added to it.
Each column in the data table can be sorted by clicking on the column name and filtering can be applied by clicking on the ‘filter icon’ ![]() adjacent to the column heading the user is wanting to apply the filter.
adjacent to the column heading the user is wanting to apply the filter.
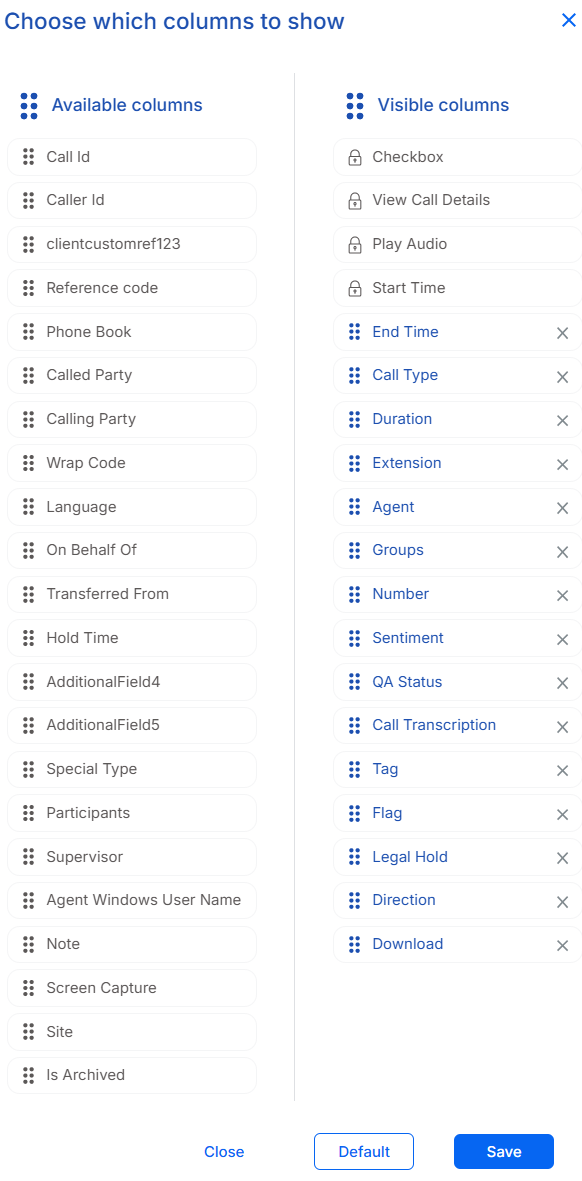
Figure – Column Selection
Searching for words or word phrases may be performed by the logged in user clicking the Search Transcripts ![]() icon as indicated by 5 in Figure – Call Listing Page. This will result in a ‘transcript search card’ appearing above the Call Data Table. For example;
icon as indicated by 5 in Figure – Call Listing Page. This will result in a ‘transcript search card’ appearing above the Call Data Table. For example;
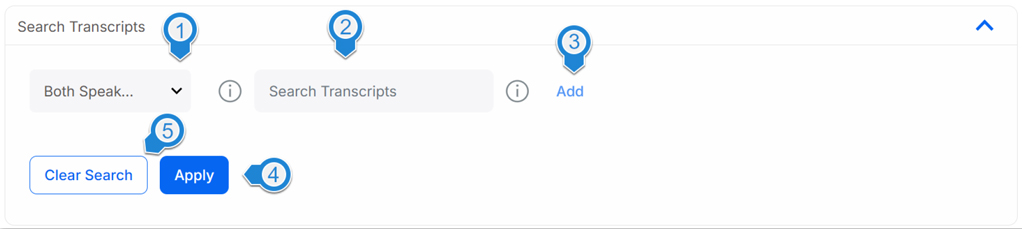
Figure – Search Transcripts
The numbers in the discussion below refer to Figure – Search Transcripts,
- The logged in user may decide whether to search the conversations for words and word phrases spoken by;
- Only the agent
- Only the customer
- Both agent and customer
This choice is made from the dropdown list that is rendered.
- Each word or word phrase that is to be searched for is entered into this field. Searches can include wildcards ( * ) or approximations ( ~n ). The order of the words does not matter.
- Once the logged in user has entered a word, for example ‘Thank’, they would press the Add button. Once done so, they may enter another word or word phrase into the ‘Search Transcripts’ field, again pressing Add when completed. This will result in a pack of word and word phrases. This will result in the card looking something like the following image;
 For each word or word phrase the user may request that all the word or word phrases must be present in the conversation, OR any of them, by clicking on the ‘and’ or ‘or’ buttons respectively.
 - Once the logged in user is satisfied with the selection of word and word phrases, they must click the Apply button to activate the search.
Below are two examples of the search. The first image illustrates the result for words ‘Thank’ or ‘bye’ being present in a call, whereas the second image illustrates that both ‘Thank’ and ‘bye’ must be present. So, and means that the word or phrase must be present in the call whereas or means that the word or phrase may be present in the call’.
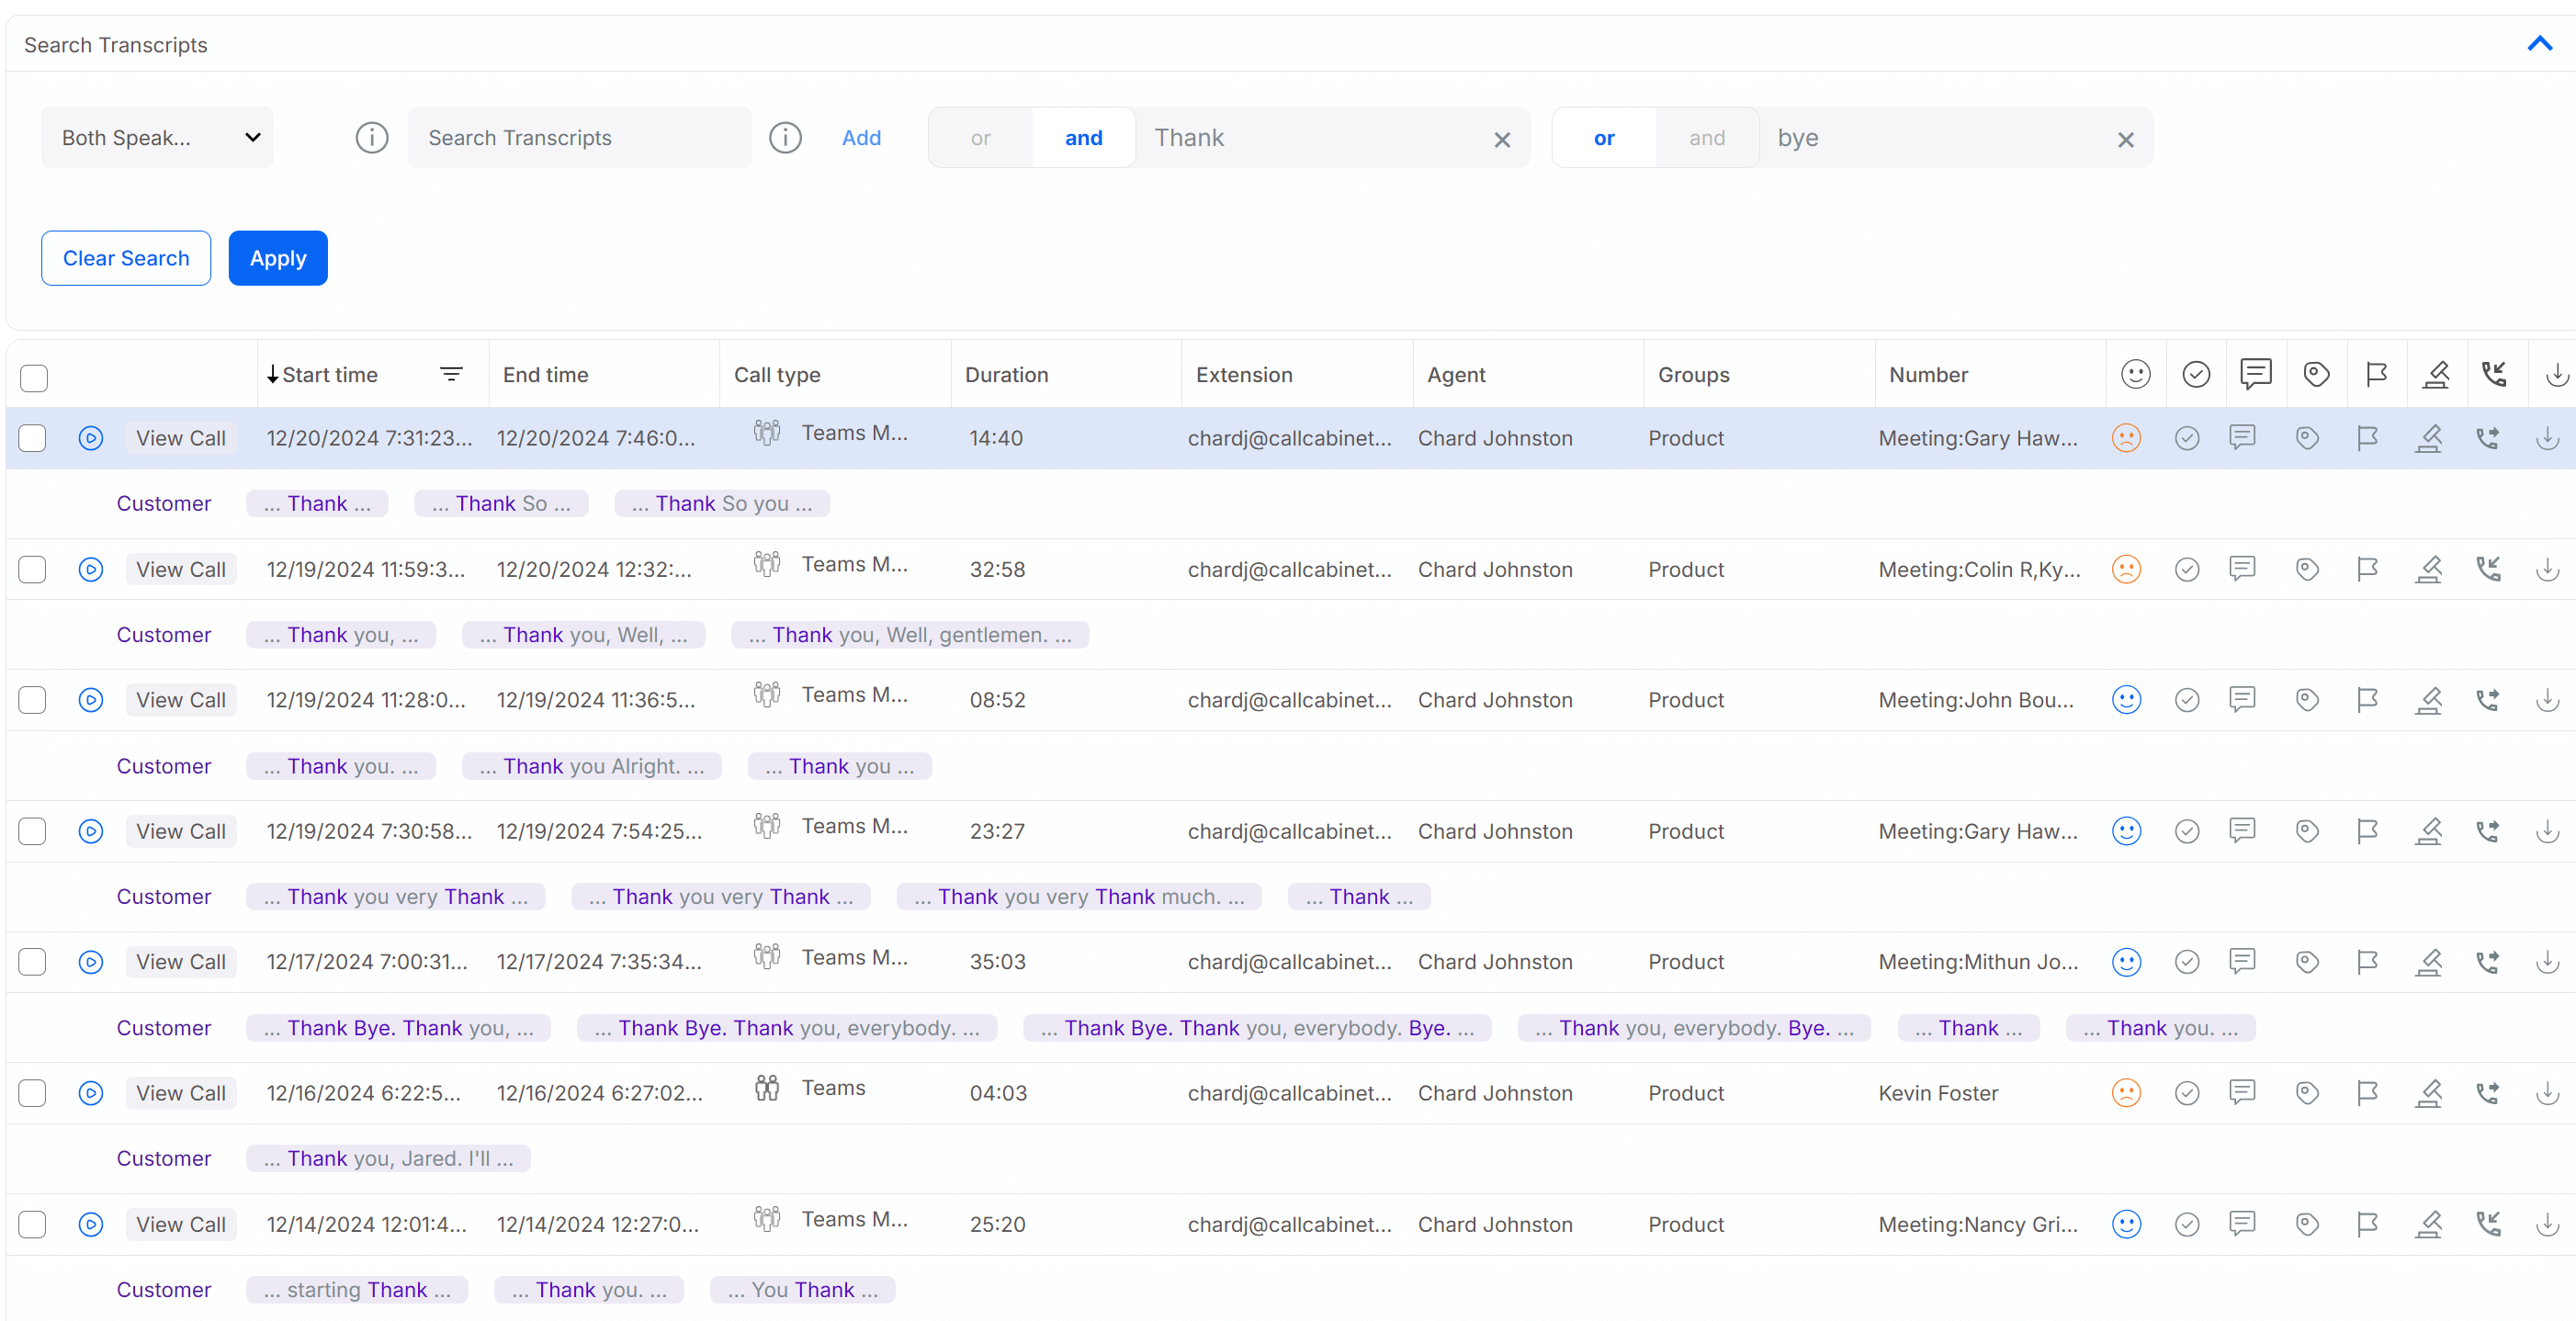
Figure – Thank OR bye
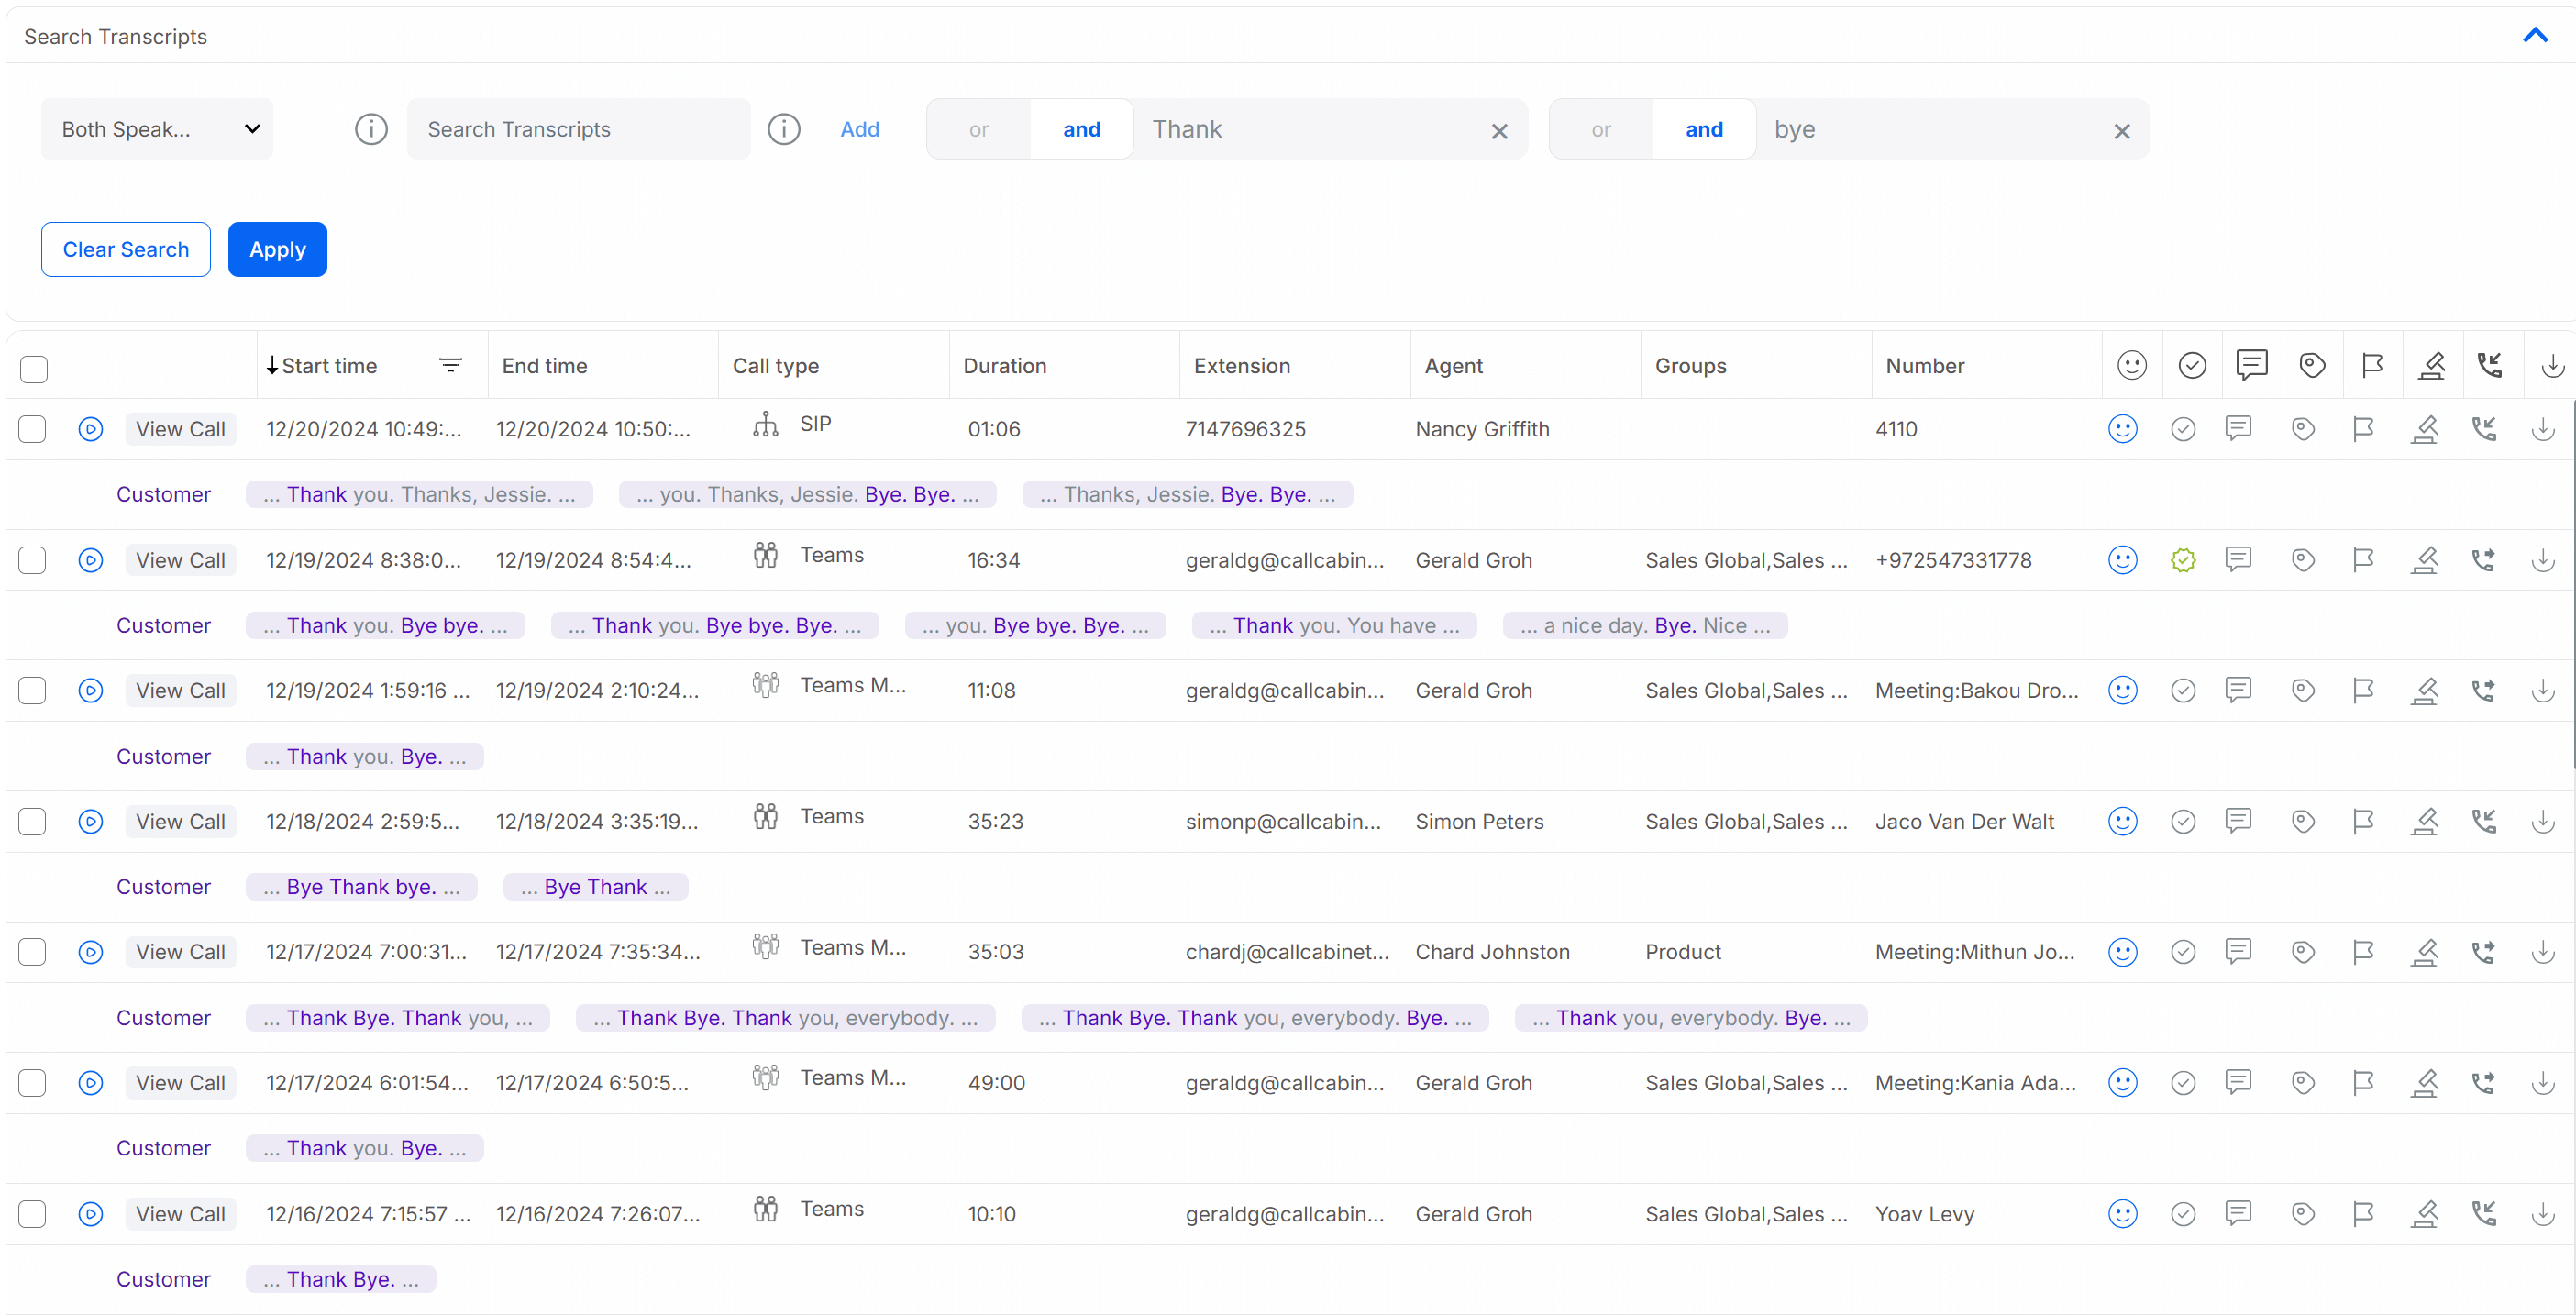
Figure – Thank AND bye
- To clear the ‘word pack’ click the Clear Search button.
NOTE: The filters as well as the transcript filters operate together. The filters will filter the calls according to the criteria set, against which the transcript filters will be applied when locating words and phrases.
Call Details Page
The call details page provides comprehensive information regarding the selected call. To access the call details page that is related to a particular call, the logged in user would click the view call button located on the same line in the call listing page’s call data table as the call whose details the user would like to view.
Please note that when a user clicks on the time zone icon ![]() located in the top right-hand side of the page’s banner, the time stamp in the call being viewed in its Call Details page will reflect the time based on the user’s selected time zone.
located in the top right-hand side of the page’s banner, the time stamp in the call being viewed in its Call Details page will reflect the time based on the user’s selected time zone.
Call details with Manual Transcription and AI Summary
NOTE: For storage-based accounts, in order to access the Call Details page an Advanced User or QA License is required.
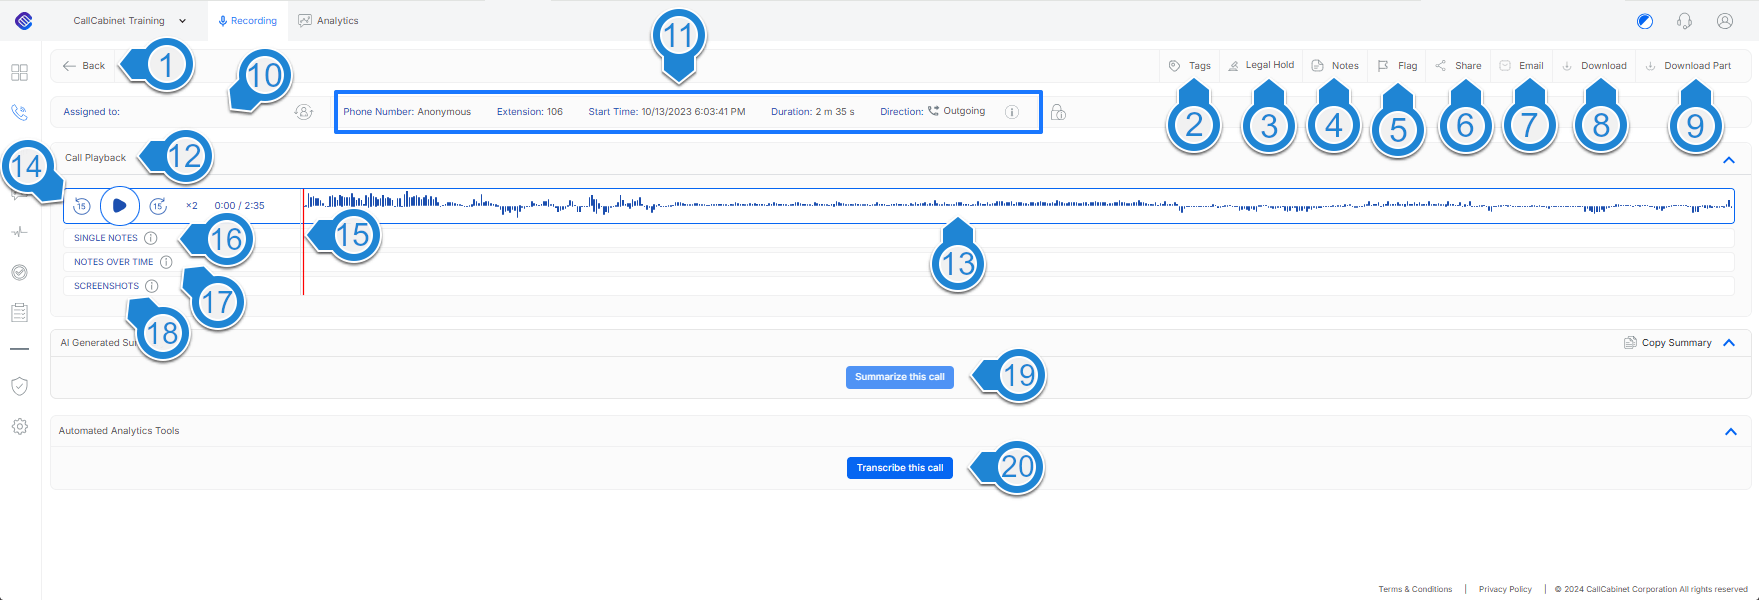
Figure – Call Details Basic
The numbers in the description below relate to the image in Figure – Call Details Basic:
- The Back button returns the user back to the Call Listing page. NOTE: It is recommended to use this button and not the browser’s back button or call listing menu item button. Doing so maintains any filters the user may have set on the Call Listing page. Using the browser’s back button or Call Listing menu item will refresh the Call Listing page and reset all the filters to default.
- Tag
 allows a user to assign custom identifiers, called tags, to the call. Tags can be created or deleted by clicking on the Settings > Call Tags menu item.
 - Legal Hold
 provides the ability to retain the call’s recording for legal or training purposes. This action will store the call’s recording and associated metadata, regardless of the system’s retention policy. The call will never be deleted while in a legal hold status. NOTE: Retention policies can be specified by clicking on the Settings > Retention Policy menu item.
 - Notes
 allow a user to apply a general note to a call’s recording. The user has 15 minutes in which to amend or delete the applied note after which the note will become a permanent record and cannot be deleted.
 - Flag
 allows a user to flag a specific call recording as an additional filtering parameter that may be applied on the Call Listing Page. Flag symbols are entirely up to a company and its users’ interpretation. Any description that makes sense to the user may be assigned to each symbol. It is up to the company and users to ensure no ambiguity exists.
 - Share
 allows a user to compliantly share a call recording and the associated information regarding the call recording, to an email address, using an encrypted share function. The compliant call share function allows the user to select what information is shared, such as audio, screen captures and notes on the call. The compliant call share function provides an email link to the recipient. When clicked, the link will direct the recipient to a hosted copy of the call recording where the recipient can playback the call. The link only provides temporary access to listen to the call, and the user can define how long that call will be available once shared. The user can set permissions to allow the recipient to add notes to the call and get notified if the recipient adds a note.
 - Email
 enables a user to send the call’s details via email.
 - Download allows a user to download the call in a non-encrypted audio format. An Admin User may configure which file format by clicking on the Settings > General Settings menu item and viewing the Company Settings -> Select Download Format section. When a user clicks on the Download item, a dialog will appear in which the logged in user may select as to where the call should be saved. Once the destination has been selected, the call downloads in the format as determined by the setting Select Download Format.
- Download Part allows a user to select a segment within the call. Once the segment has been determined the user may download this segment in a non-encrypted audio format by clicking the ‘standalone’ download icon that appears. Should the user decide not to download part of the call, they may press the Cancel button. Once the call segment has been downloaded, to clear the selected segment the logged in user should click the Cancel button. An Admin User may config which file format by clicking on the Settings > General Settings menu item and viewing the Company Settings -> Select Download Format section.
- The Assigned To section displays the agent’s name the call recording is assigned to, their extension number, and email address. The user may reassign the call recording to another agent by clicking (RE-ASSIGN)
 . Doing so, will open a dialog pane in which the user may select the desired agent they wish to become associated with the call. Once reassigned, there will be no change to any historical records, except for the call recording the user has just reassigned. An example of this dialog is:
- The Call Info section describes information regarding the call’s recording, including the caller’s phone number, call duration and whether the call was incoming or outgoing. The Access Log section, illustrated by the icon
 is a complete audit trail describing which users have interacted with a call’s recording, and what interaction occurred. By clicking this icon, the user’s name is displayed, as well as the date and time each user used the playback feature, made a note, shared the call, or downloaded the call.
 - The Call Playback section allows a user to navigate directly to a portion of the call they would like to hear by clicking locations within the oscillogram.
- The recorded call’s oscillogram which is a graphical representation of the call’s audio
- The user may pause the playback, select to ‘rewind’ 15 seconds by pressing the rewind icon
 or select to ‘fast forward’ 15 seconds by pressing the forward icon
  . The user may select the x2 icon to play the recording at twice the recorded speed.
 - When the call is being played, this vertical bar indicates the relative position of the audio being heard.
- Single Notes allows the user to add numerous single notes pinned to a specific point in time in the call by clicking in the single notes bar. The point at which the note is added is indicated by the
 icon.
icon. - The Notes Over Time section allows a user to add a note over a specific time period by clicking on the notes over time bar. The resulting icon indicating the ‘note over time’ is
 .
. - The Screenshots section is where the user is able to view any screenshots associated with the call.
NOTE: Screenshots are only available with CallCabinet’s Agent Client Installation and associated licensing. - The AI Generated Summary section displays a summary of the call after the user clicks the Summarize this Call button, indicated by 19. There are two ways in which this summary may be generated. A) Clicking the Call Transcription icon in the Call Listing page (See Call Listing page section for details on this) or B) clicking the Summarize this Call, indicated by 19. When the user does this a call summary is generated, and displayed in the Call details page. An example of this is illustrated below:

NOTE: The AI-generated summaries are designed to be longer and more comprehensive by default, providing richer context and deeper insight into the conversation. - The transcript section displays a transcript of the call after the user clicks on the Transcript this Call button indicated by 20. There are two ways in which this transcript may be generated. A) Clicking the Call Transcription icon in the Call Listing page (See Call Listing page section for details on this) or B) clicking the Transcribe this Call, indicated by 20. When the user does this a call transcript is generated, and displayed in the Call details page. An example of this is illustrated below:

NOTE: AI Summary and Transcription are a complimentary manual service offered by CallCabinet.
NOTE: Transcription requires the extension the call accesses have the “Transcription Type” selected from the dropdown list that appears when clicked. The current options are;
- Transcription
- Standard Analytics
- Advanced Analytics
NOTE: Video and Screen Share recording requires that the agent participating in the call has permission to do so by ensuring that the “Enable Screen Capture/Video” checkbox is checked under their profile.
Call details with PCI DSS Redaction with Video, Screenshots and Share Screen
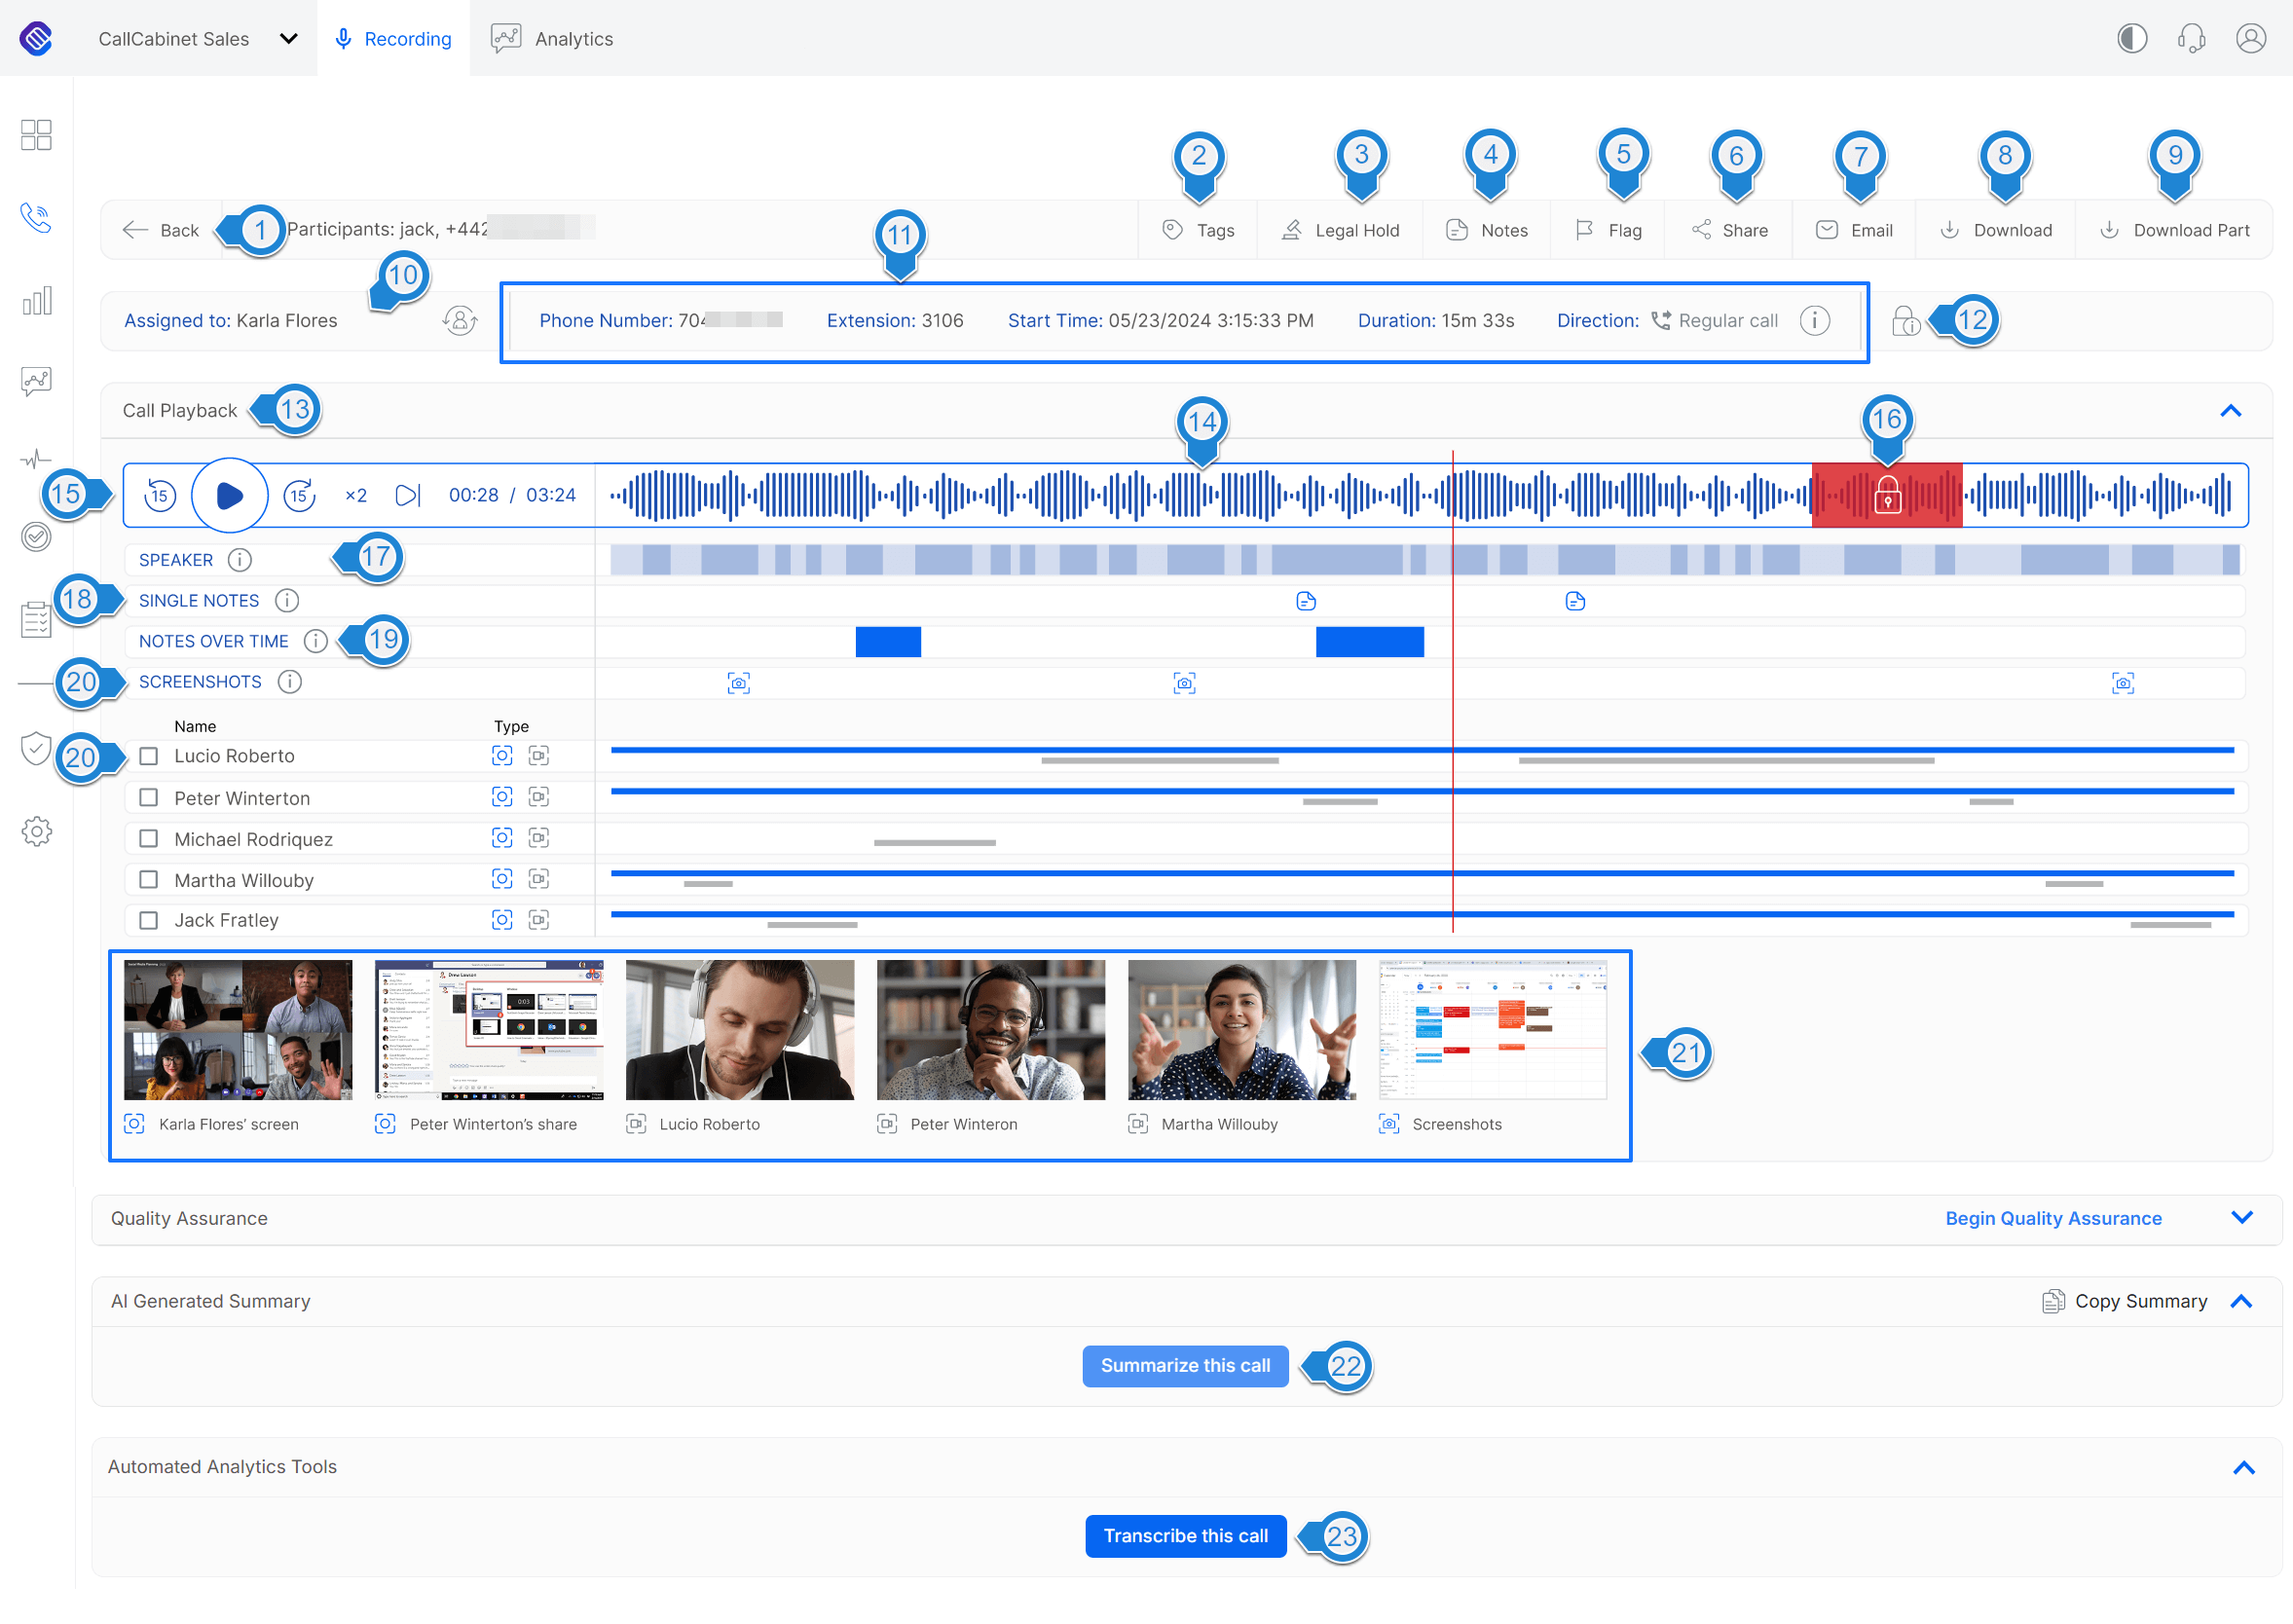
Figure – Call Details with PCI DSS Redaction, video and screenshot
NOTE: In order to access the Call Details page an Advanced User or QA License is required if the account is storage based.
The numbers in the description below relate to the image in Figure – Call Details with PCI DSS Redaction, video and screenshot:
- The Back button returns the user back to the Call Listing page. NOTE: It is recommended to use this button and not the browser’s back button or call listing menu item button. Doing so maintains any filters the user may have set on the allows a user to assign custom identifiers, called tags, to the call. Tags can be created or deleted by clicking on the Settings > Call Tags menu item. page. Using the browser’s back button or Call Listing menu item will refresh the Call Listing page and reset all the filters to default.
- Tag allows a user to assign custom identifiers, called tags, to the call. Tags can be created or deleted by clicking on the Settings > Call Tags menu item.
- Legal Hold provides the ability to retain the call’s recording for legal or training purposes. This action will store the call’s recording and associated metadata, regardless of the system’s retention policy. The call will never be deleted while in a legal hold status.
NOTE: Retention policies can be specified by clicking on the Settings > Retention Policy menu item. - Notes allow a user to apply a general note to a call’s recording. The user has 15 minutes in which to amend or delete the applied note after which the note will become a permanent record and cannot be deleted.
- Flag allows a user to flag a specific call recording as an additional filtering parameter that may be applied on the Call Listing Page. Flag symbols are entirely up to a company and its users’ interpretation. Any description that makes sense to the user may be assigned to each symbol. It is up to the company and users to ensure no ambiguity exists.
- Share allows a user to compliantly share a call recording and the associated information regarding the call recording, to an email address, using an encrypted share function. The compliant call share function allows the user to select what information is shared, such as audio, screen captures and notes on the call. The compliant call share function provides an email link to the recipient. When clicked, the link will direct the recipient to a hosted copy of the call recording where the recipient can playback the call. The link only provides temporary access to listen to the call, and the user can define how long that call will be available once shared. The user can set permissions to allow the recipient to add notes to the call and get notified if the recipient adds a note.
- Email enables a user to send the call’s details via email.
- Download allows a user to download the call in a non-encrypted audio format. An admin user may configure which file format by clicking on the Settings > General Settings menu item and viewing the Company Settings -> Select Download Format section. When a user clicks on the Download
item, a dialog will appear in which the logged in user may select as to where the call should be saved. Once the destination has been selected, the call downloads in the format as determined by the setting Select Download Format. - Download Part that appears. Should the user decide not to download part of the call, they may press the Cancel button. Once the call segment has been downloaded, to clear the selected segment the logged in user should click the Cancel button. An admin user may config which file format by clicking on the Settings > General Settings menu item and viewing the Company Settings -> Select Download Format section.
- The Assigned To section displays the agent’s name the call recording is assigned to, their extension number, and email address. The user may reassign the call recording to another agent by clicking (RE-ASSIGN) . Doing so, will open a dialog pane in which the user may select the desired agent they wish to become associated with the call. Once reassigned, there will be no change to any historical records, except for the call recording the user has just reassigned. An example of this dialog is:
- The Call Info section describes information regarding the call’s recording, including the caller’s phone number, call duration and whether the call was incoming or outgoing.
- The Access Log illustrated by the icon is a complete audit trail describing which users have interacted with a call’s recording, and what interaction occurred. By clicking this icon, the user’s name is displayed, as well as the date and time each user used the playback feature, made a note, shared the call, or downloaded the call.
- The Call Playback section allows a user to navigate directly to a portion of the call they would like to hear by clicking locations within the oscillogram.
- The recorded call’s oscillogram. The ‘top-half audio’ represents the first speaker, whilst the ‘bottom-half audio’ represents the second speaker.
- The user may pause the playback, select to ‘rewind’ 15 seconds by pressing the rewind icon or select to ‘fast forward’ 15 seconds by pressing the forward icon . The user may select the x2 icon to play the recording at twice the recorded speed.
- Shows an example of PCI DSS Redaction of personal and private information within the call’s oscillogram. This is where an agent received sensitive client information that has been redacted. It will not be available in the call’s playback. PCI DSS Compliance Redaction is used for personal Information such as Credit Cards, Social Security Numbers, etc. Manual redaction of personal and private information is only possible with the CallCabinet Agent Client Installation and associated licensing.
- Speaker indicates when there is a change in speaker. Notice that the ‘bar’ takes on a darker color when the recording is in stereo.
- Single Notes allows the user to add numerous single notes pinned to a specific point in time in the call by clicking in the single notes bar. The point at which the note is added is indicated by the icon.
- The Notes Over Time section allows a user to add a note over a specific time period by clicking on the notes over time bar. The resulting icon indicating the ‘note over time’ is .
- The Screenshots section is where the user is able to view any screenshots associated with the call.
NOTE: Screenshots are only available with CallCabinet’s Agent Client Installation and associated licensing. - The Screenshots display area is where the user may view and enlarge videos, shares and screenshots accordingly.
- The AI Generated Summary section displays a summary of the call after the user clicks the Summarize this Call button, indicated by 19. There are two ways in which this summary may be generated. A) Clicking the Call Transcription icon in the Call Listing page (See Call Listing page section for details on this) or B) clicking the Summarize this Call, indicated by 19. When the user does this a call summary is generated, and displayed in the Call details page. An example of this is illustrated below:
- The transcript section displays a transcript of the call after the user clicks on the Transcript this Call button indicated by 20. There are two ways in which this transcript may be generated. A) Clicking the Call Transcription icon in the Call Listing page (See Call Listing page section for details on this) or B) clicking the Transcribe this Call, indicated by 20. When the user does this a call transcript is generated, and displayed in the Call details page. An example of this is illustrated below:
NOTE: AI Summary and Transcription are a complimentary manual service offered by CallCabinet.
NOTE: Transcription requires the extension the call accesses have the “Transcription Type” selected from the dropdown list that appears when clicked. The current options are;
- Transcription
- Standard Analytics
- Advanced Analytics
NOTE: Manual PCI DSS redaction requires that the agent participating in the call has permission to do so by ensuring that the “Manual PCI” checkbox is checked in their agent’s profile and the “Redaction Automated” checkbox in the extension associated with this is unchecked.
NOTE: Automatic PCI DSS redaction requires that the extension the call accesses has the “Redaction Automated” checkbox checked in its profile, and the agent associated with this extension has the “Manual PCI” checkbox unchecked in its profile.
NOTE: Video and Screen Share recording requires that the agent participating in the call has permission to do so by ensuring that the “Enable Screen Capture/Video” checkbox is checked under their profile.
Call details with Speech-to-Text Transcription
NOTE: In order to access the Call Details page an Advanced User or QA License is required if the account is storage based.
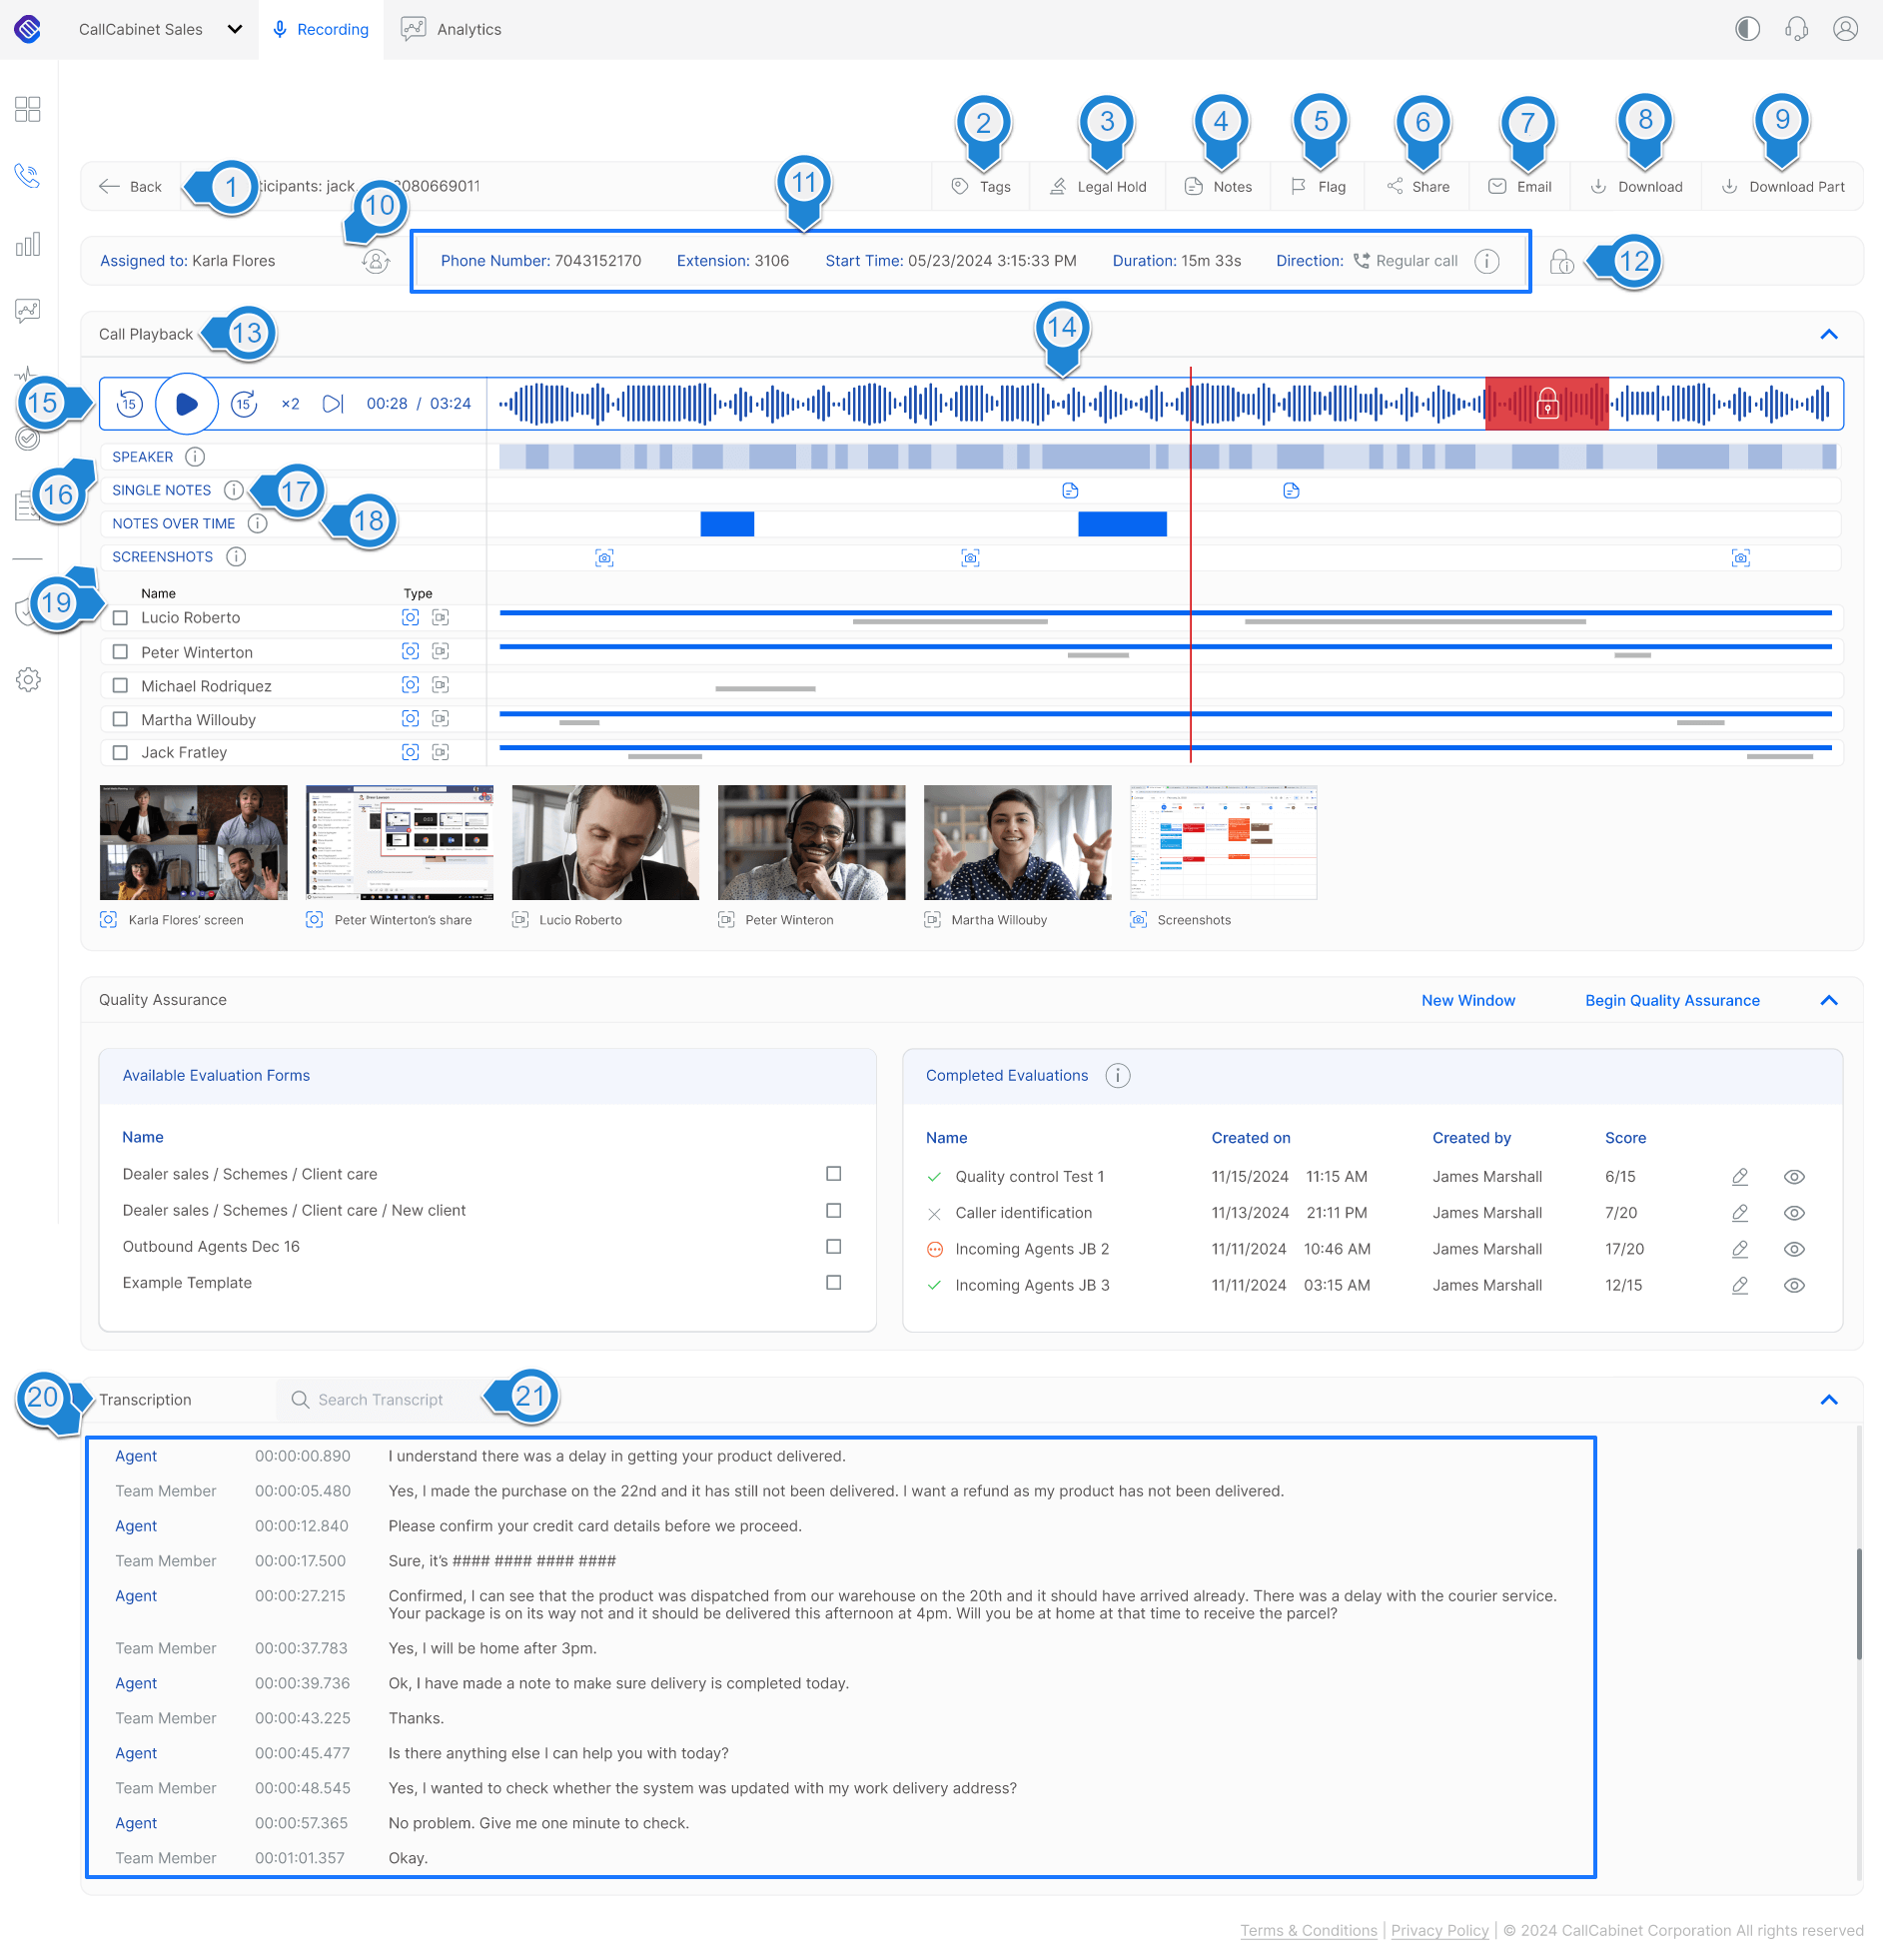
Figure – Call Details with Speech-to Text Translation
The numbers in the description below relate to the image in Figure – Call Details with Speech-to Text Translation:
- The Back button returns the user back to the Call Listing page.
NOTE: It is recommended to use this button and not the browser’s back button or call listing menu item button. Doing so maintains any filters the user may have set on the Call Listing page. Using the browser’s back button or Call Listing menu item will refresh the Call Listing page and reset all the filters to default. - Tag allows a user to assign custom identifiers, called tags, to the call. Tags can be created or deleted by clicking on the Settings > Call Tags menu item.
- Legal Hold provides the ability to retain the call’s recording for legal or training purposes. This action will store the call’s recording and associated metadata, regardless of the system’s retention policy. The call will never be deleted while in a legal hold status.
NOTE: Retention policies can be specified by clicking on the Settings > Retention Policy menu item. - Notes allow a user to apply a general note to a call’s recording. The user has 15 minutes in which to amend or delete the applied note after which the note will become a permanent record and cannot be deleted.
- Flag allows a user to flag a specific call recording as an additional filtering parameter that may be applied on the Call Listing Page. Flag symbols are entirely up to a company and its users’ interpretation. Any description that makes sense to the user may be assigned to each symbol. It is up to the company and users to ensure no ambiguity exists.
- Share allows a user to compliantly share a call recording and the associated information regarding the call recording, to an email address, using an encrypted share function. The compliant call share function allows the user to select what information is shared, such as audio, screen captures and notes on the call. The compliant call share function provides an email link to the recipient. When clicked, the link will direct the recipient to a hosted copy of the call recording where the recipient can playback the call. The link only provides temporary access to listen to the call, and the user can define how long that call will be available once shared. The user can set permissions to allow the recipient to add notes to the call and notify the user if the recipient adds a note.
- Email enables a user to send the call’s details via email.
- Download allows a user to download the call in a non-encrypted audio format. An Admin User may configure which file format by clicking on the Settings > General Settings menu item and viewing the Company Settings -> Select Download Format section. When a user clicks on the Download item, a dialog will appear in which the logged in user may select as to where the call should be saved. Once the destination has been selected, the call downloads in the format as determined by the setting Select Download Format
- Download Part allows a user to select a segment within the call. Once the segment has been determined the user may download this segment in a non-encrypted audio format by clicking the ‘standalone’ download icon that appears. Should the user decide not to download part of the call, they may press the Cancel button. Once the call segment has been downloaded, to clear the selected segment the logged in user should click the Cancel button. An Admin user may config which file format by clicking on the Settings > General Settings menu item and viewing the Company Settings -> Select Download Format section.
- The Assigned To section displays the agent’s name the call recording is assigned to, their extension number, and email address. The user may reassign the call recording to another agent by clicking (RE-ASSIGN) . Doing so, will open a dialog pane in which the user may select the desired agent they wish to become associated with the call. Once reassigned, there will be no change to any historical records, except for the call recording the user has just reassigned. An example of this dialog is:
- The Call Info section describes information regarding the call’s recording, including the caller’s phone number, call duration and whether the call was incoming or outgoing.
- The Access Log illustrated by the icon is a complete audit trail describing which users have interacted with a call’s recording, and what interaction occurred. By clicking this icon, the user’s name is displayed, as well as the date and time each user used the playback feature, made a note, shared the call, or downloaded the call.
- The Call Playback section allows a user to navigate directly to a portion of the call they would like to hear by clicking locations within the oscillogram.
- The recorded call’s oscillogram. The ‘top-half audio’ represents the first speaker, whilst the ‘bottom-half audio’ represents the second speaker.
- The user may pause the playback, select to ‘rewind’ 15 seconds by pressing the rewind icon or select to ‘fast forward’ 15 seconds by pressing the forward icon . The user may select the x2 icon to play the recording at twice the recorded speed.
- Speaker indicates when there is a change in speaker. Notice that the ‘bar’ takes on a darker color when the recording is in stereo.
- Single Notes allows the user to add numerous single notes pinned to a specific point in time in the call by clicking in the single notes bar. The point at which the note is added is indicated by the icon.
- The Notes Over Time section allows a user to add a note over a specific time period by clicking on the notes over time bar. The resulting icon indicating the ‘note over time’ is .
- The Screenshots section is where users are able to view any screenshots associated with the call.
NOTE: Screenshots are only available with CallCabinet’s Agent Client Installation and associated licensing. - The Machine Transcription section is where speech-to-text transcription will appear. Speech-to-text transcription is only available with CallCabinet’s analytics or transcription licensing. The Call Transcription provides a full speech-to-text transcription of the recorded (stereo) call. This area will highlight and synchronize showing the portion of the call the caller or the agent is speaking during playback. It is possible to export the transcription. NOTE: The Call Transcription function requires CallCabinet’s Voice Analytics
- Categories and Keywords provide the function of the call transcription to search for keywords or phrases throughout the entire call transcript. The words and phrases are then highlighted in the transcript.
NOTE: This function requires CallCabinet’s Voice Analytics.
NOTE: Transcription requires the extension the call accesses have the “Transcription Type” selected from the dropdown list that appears when clicked. The current options are;
- Transcription
- Standard Analytics
- Advanced Analytics
Call details page with Quality Assurance (QA)
NOTE: In order to access the Call Details page an Advanced User or QA License is required if the account is storage based.
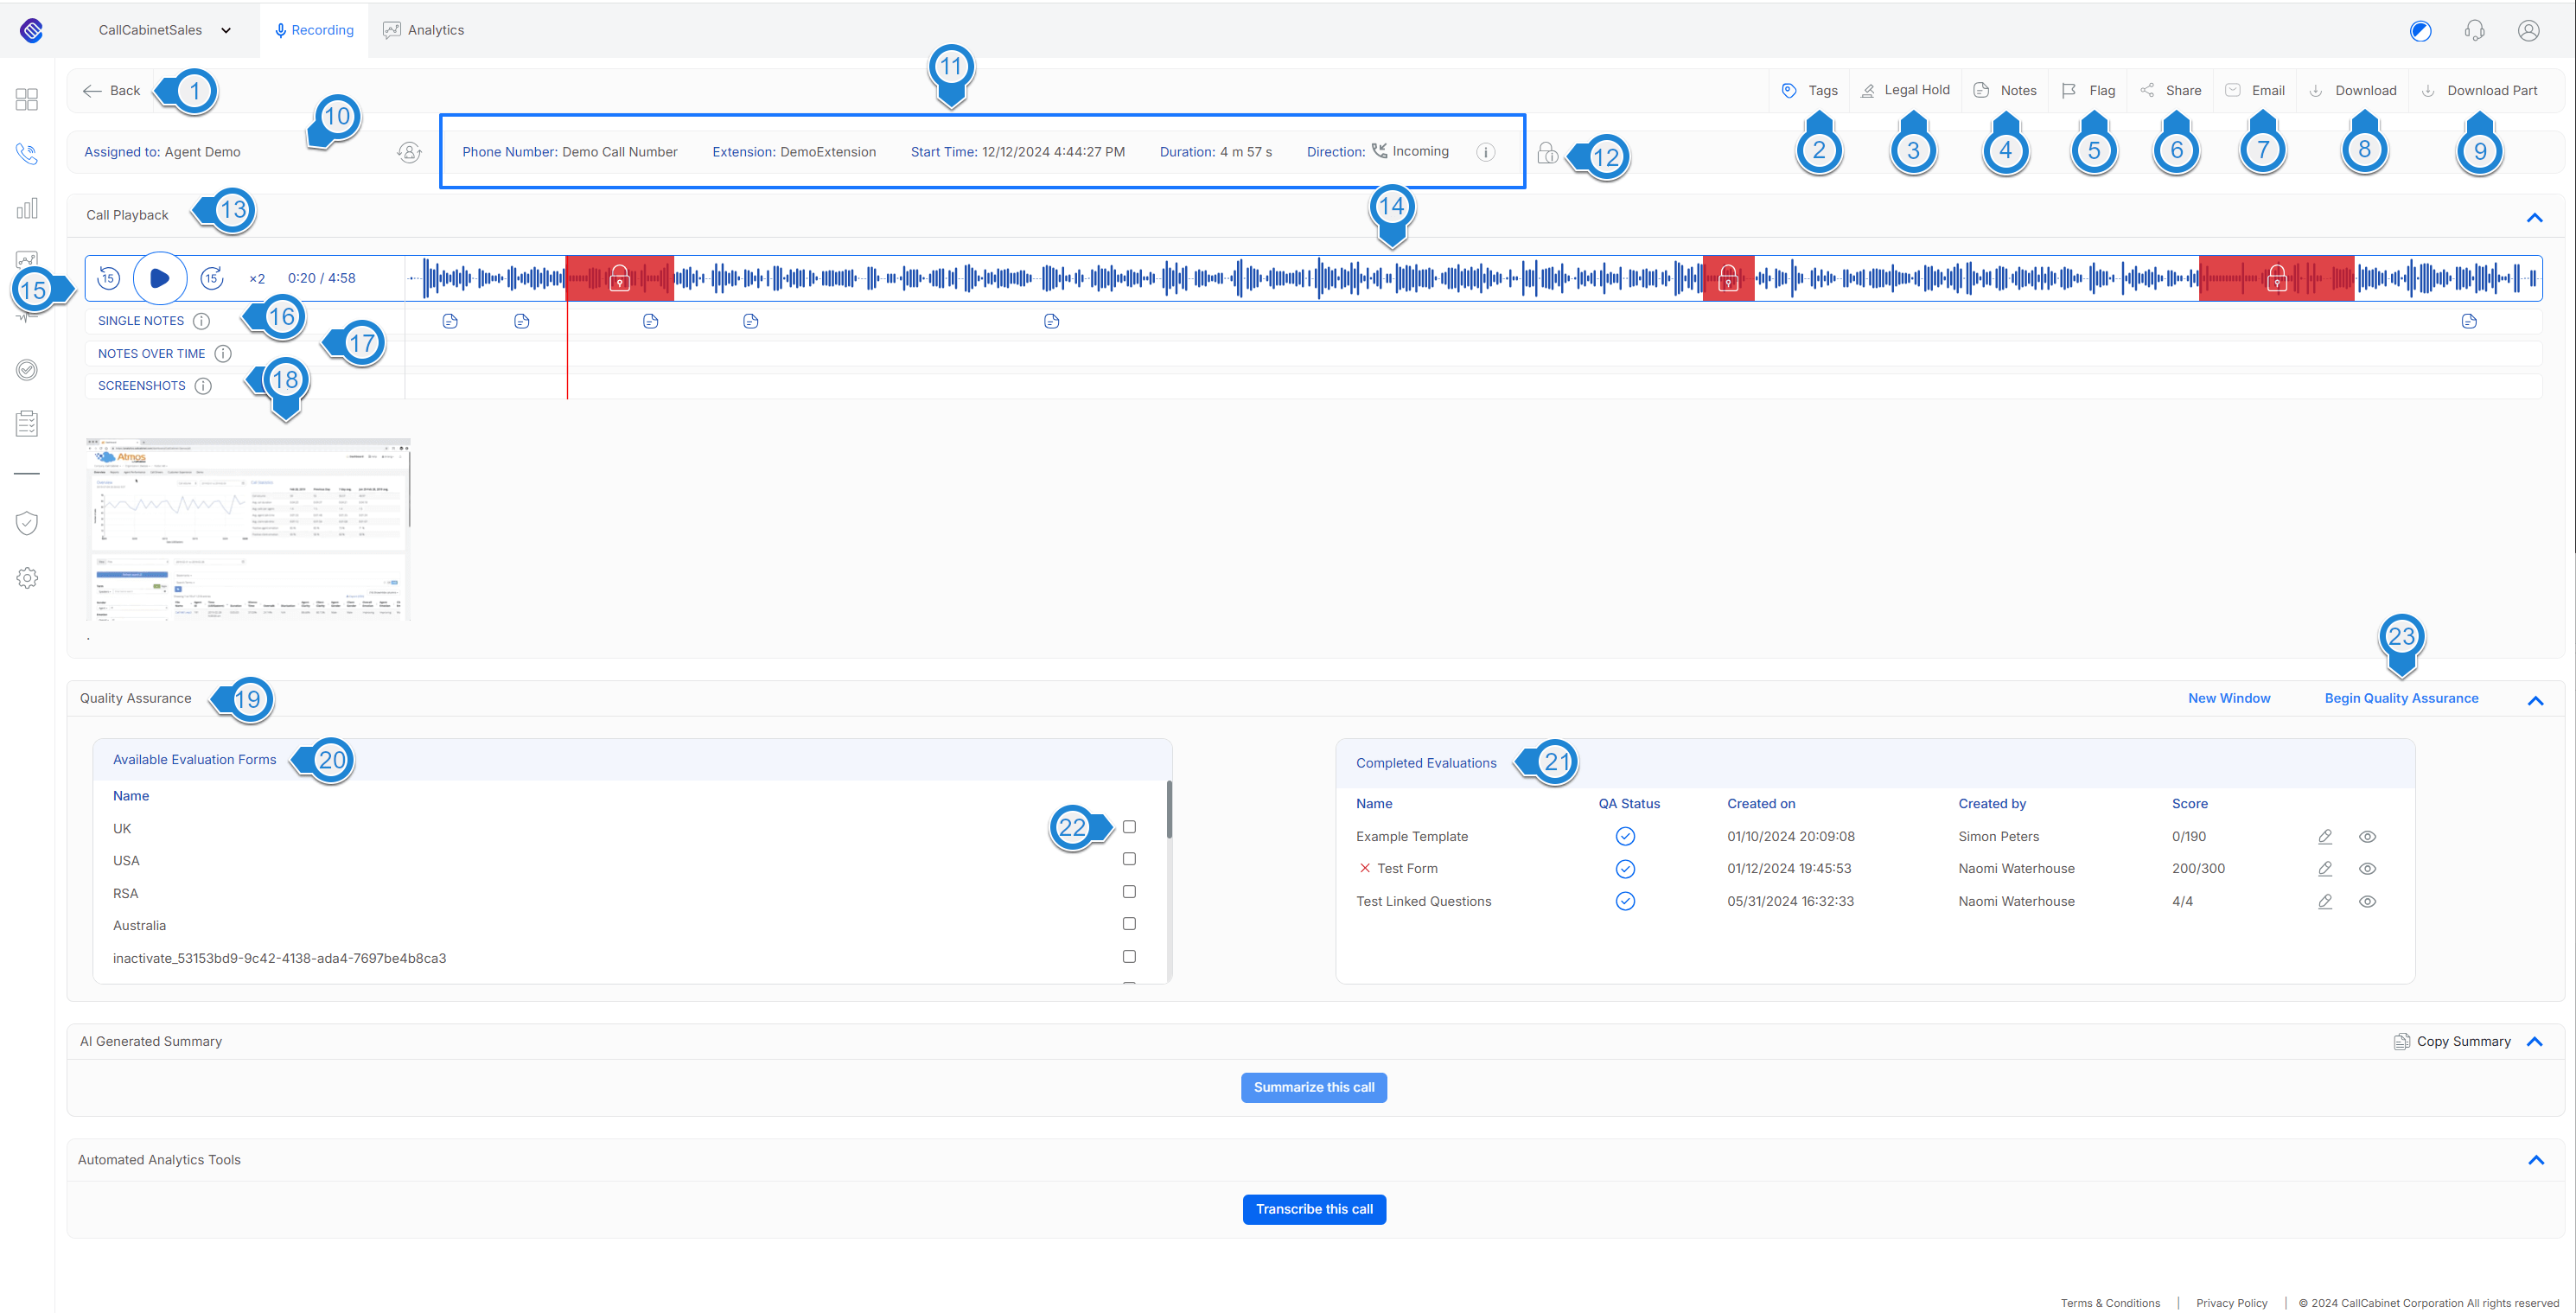
Figure – Call Details with Quality Assurance
The numbers in the description below relate to the image in Figure – Call Details with Quality Assurance:
- The Back button returns the user back to the Call Listing page. NOTE: It is recommended to use this button and not the browser’s back button or call listing menu item button. Doing so maintains any filters the user may have set on the Call Listing page. Using the browser’s back button or Call Listing menu item will refresh the Call Listing page and reset all the filters to default.
- Tag allows a user to assign custom identifiers, called tags, to the call. Tags can be created or deleted by clicking on the Settings > Call Tags menu item.
- Legal Hold provides the ability to retain the call’s recording for legal or training purposes. This action will store the call’s recording and associated metadata, regardless of the system’s retention policy. The call will never be deleted while in a legal hold status.
NOTE: Retention policies can be specified by clicking on the Settings > Retention Policy menu item. - Notes allow a user to apply a general note to a call’s recording. The user has 15 minutes in which to amend or delete the applied note after which the note will become a permanent record and cannot be deleted.
- Flag allows a user to flag a specific call recording as an additional filtering parameter that may be applied on the Call Listing Page. Flag symbols are entirely up to a company and its users’ interpretation. Any description that makes sense to the user may be assigned to each symbol. It is up to the company and users to ensure no ambiguity exists.
- Share allows a user to compliantly share a call recording and the associated information regarding the call recording, to an email address, using an encrypted share function. The compliant call share function allows the user to select what information is shared, such as audio, screen captures and notes on the call. The compliant call share function provides an email link to the recipient. When clicked, the link will direct the recipient to a hosted copy of the call recording where the recipient can playback the call. The link only provides temporary access to listen to the call, and the user can define how long that call will be available once shared. The user can set permissions to allow the recipient to add notes to the call and get notified if the recipient adds a note.
- Email enables a user to send the call’s details via email.
- Download allows a user to download the call in a non-encrypted audio format. An Admin User may configure which file format by clicking on the Settings > General Settings menu item and viewing the Company Settings -> Select Download Format section. When a user clicks on the Download item, a dialog will appear in which the logged in user may select as to where the call should be saved. Once the destination has been selected, the call downloads in the format as determined by the setting Select Download Format.
- Download Part allows a user to select a segment within the call. Once the segment has been determined the user may download this segment in a non-encrypted audio format by clicking the ‘standalone’ download icon that appears. Should the user decide not to download part of the call, they may press the Cancel button. Once the call segment has been downloaded, to clear the selected segment the logged in user should click the Cancel button. An Admin User may config which file format by clicking on the Settings > General Settings menu item and viewing the Company Settings -> Select Download Format section.
- The Assigned To section displays the agent’s name the call recording is assigned to, their extension number, and email address. The user may reassign the call recording to another agent by clicking (RE-ASSIGN) . Doing so, will open a dialog pane in which the user may select the desired agent they wish to become associated with the call. Once reassigned, there will be no change to any historical records, except for the call recording the user has just reassigned. An example of this dialog is:
- The Call Info section describes information regarding the call’s recording, including the caller’s phone number, call duration and whether the call was incoming or outgoing.
- The Access Log illustrated by the icon is a complete audit trail describing which users have interacted with a call’s recording, and what interaction occurred. By clicking this icon, the user’s name is displayed, as well as the date and time each user used the playback feature, made a note, shared the call, or downloaded the call.
- The Call Playback section allows a user to navigate directly to a portion of the call they would like to hear by clicking locations within the oscillogram.
- The recorded call’s oscillogram. The ‘top-half audio’ represents the first speaker, whilst the ‘bottom-half audio’ represents the second speaker.
- The user may pause the playback, select to ‘rewind’ 15 seconds by pressing the rewind icon or select to ‘fast forward’ 15 seconds by pressing the forward icon . The user may select the x2 icon to play the recording at twice the recorded speed.
- Single Notes allows the user to add numerous single notes pinned to a specific point in time in the call by clicking in the single notes bar. The point at which the note is added is indicated by the icon.
- The Notes Over Time section allows a user to add a note over a specific time period by clicking on the notes over time bar. The resulting icon indicating the ‘note over time’ is .
- The Screenshots section is where users are able to view any screenshots associated with the call.
NOTE: Screenshots are only available with CallCabinet’s Agent Client Installation and associated licensing. - The Quality Assurance card.
- The Available Evaluation Forms section. All the evaluation forms (scorecards) that are available for use in performing an evaluation are listed here. These evaluation forms would have been previously created using the scorecard editor. Within each form, users can manually respond to a series of questions. Once completed, they can add detailed notes and share the evaluation with the relevant agents for review and action.
- All the completed evaluations are listed in the Completed Evaluation section. It does not matter whether the evaluation has been performed automatically by CallCabinet’s analytics tool or manually, all of them are listed here. The user may view these evaluations by clicking on the ‘eye’ icon
 . Should the logged in user not agree with the automated evaluation, they ‘override’ it by performing a manual evaluation. To do so the user clicks the edit icon
  associated with the evaluation they want to override. By adjusting specific answers, the user may believe to be inaccurate or incomplete, allowing for a more nuanced and fastidious evaluation of performance.
 - To perform an evaluation manually, the logged in user will select the evaluation form they would like to use by checking the checkbox associated with the desired evaluation form.
- Once the logged in user selects the evaluation form, they would like to use from those available in the Available Evaluation Form list as indicated by 22, by checking the checkbox associated with the required evaluation form, they would then click the Begin Quality Assurance button. This will result in the evaluation form’s questions becoming rendered in the view. The logged in user may now proceed with the manual evaluation. An example of the questions being rendered once this button (23) is clicked is;

NOTE: The icon that is rendered under the QA Status column in the Call Listing page indicates whether the QA performed was a manual![]() , automatic
, automatic ![]() or both
or both ![]() .
.
NOTE: Quality Assurance evaluations are only available with CallCabinet’s Quality Assurance licensing.
Call details page with Analytics
NOTE: In order to View Analytics an Analytics License is required
NOTE: In order to record video or screen capture a Screen Capture / Video License is required.
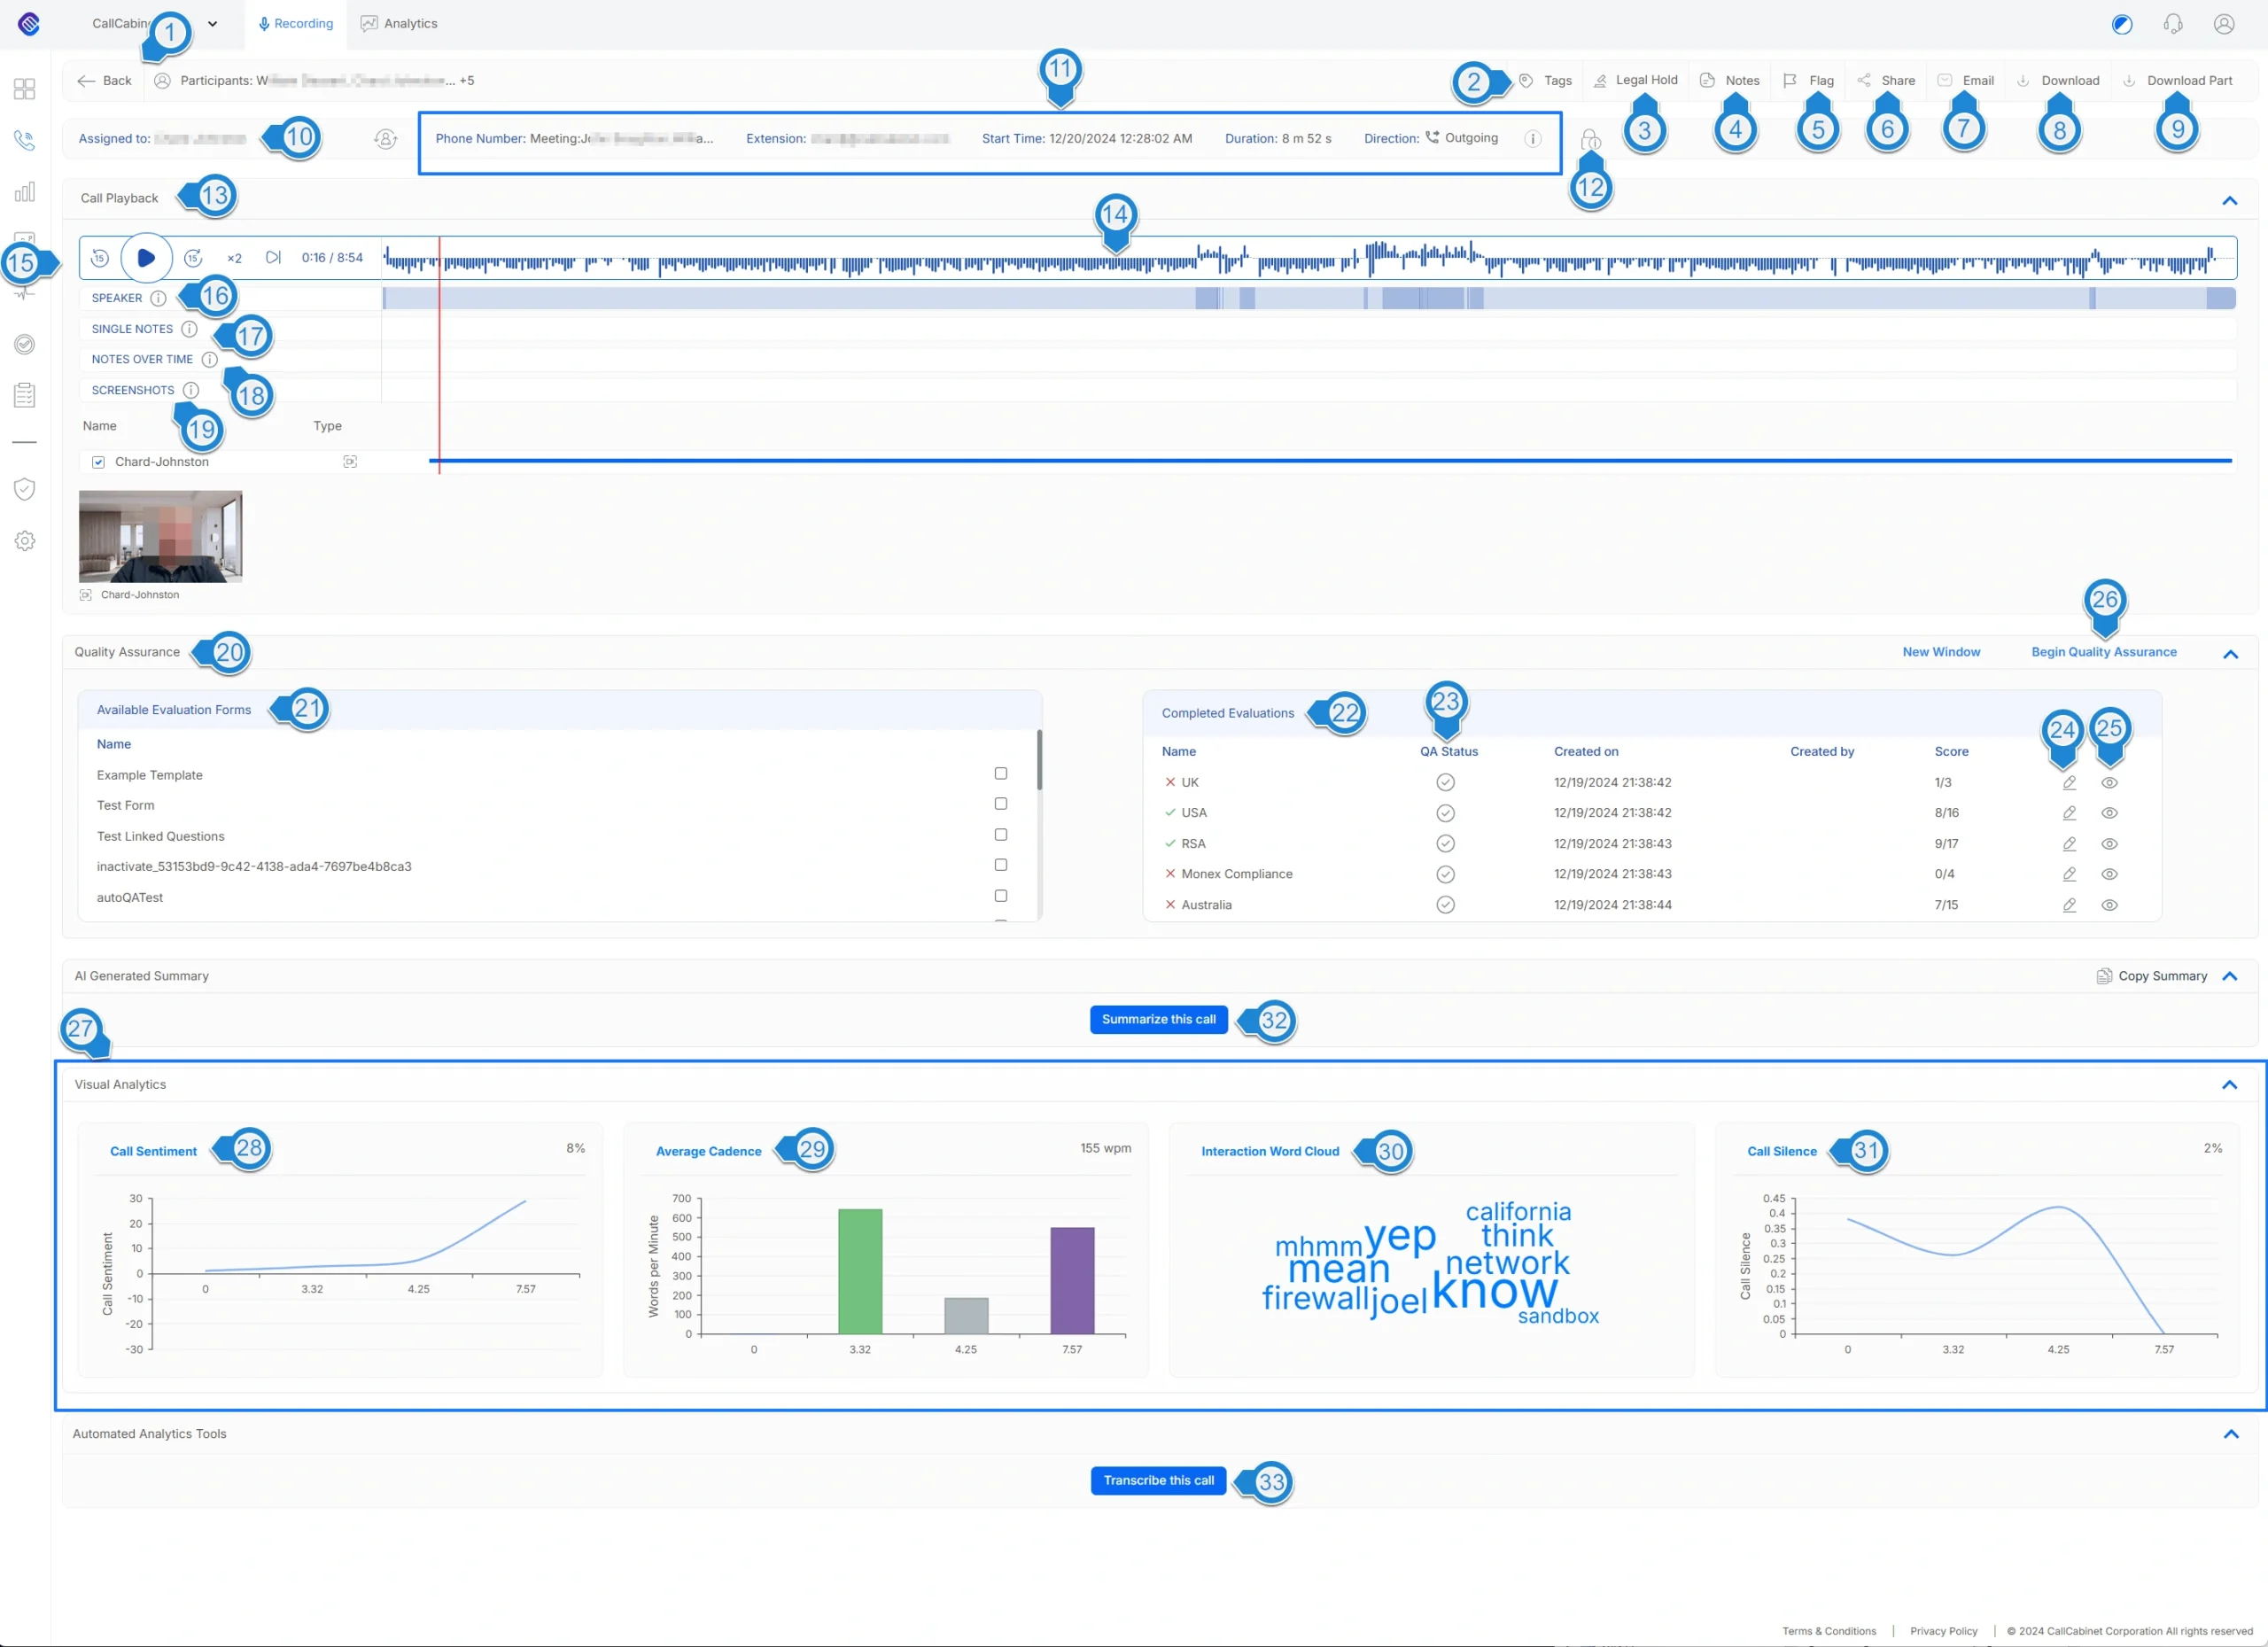
Figure – Call Details with Quality Assurance and Analytics
The numbers in the description below relate to the image in Figure – Call Details with Quality Assurance and Analytics: By having an analytics license the quality assurance, visual analytics and transcription cards are enabled. Note too that quality assurance, call summary and call transcription will happen automatically for every call when an Analytics license is purchased.
- The Back button returns the user back to the Call Listing page. NOTE: It is recommended to use this button and not the browser’s back button or call listing menu item button. Doing so maintains any filters the user may have set on the Call Listings page. Using the browser’s back button or Call Listing menu item will refresh the Call Listings page and reset all the filters to default.
- Tag allows a user to assign custom identifiers, called tags, to the call. Tags can be created or deleted by clicking on the Settings > Call Tags menu item.
- Legal Hold provides the ability to retain the call’s recording for legal or training purposes. This action will store the call’s recording and associated metadata, regardless of the system’s retention policy. The call will never be deleted while in a legal hold status.
NOTE: Retention policies can be specified by clicking on the Settings > Retention Policy menu item. - Notes allow a user to apply a general note to a call’s recording. The user has 15 minutes in which to amend or delete the applied note after which the note will become a permanent record and cannot be deleted.
- Flag allows a user to flag a specific call recording as an additional filtering parameter that may be applied on the Call Listing Page. Flag symbols are entirely up to a company and its users’ interpretation. Any description that makes sense to the user may be assigned to each symbol. It is up to the company and users to ensure no ambiguity exists.
- Share allows a user to compliantly share a call recording and the associated information regarding the call recording, to an email address, using an encrypted share function. The compliant call share function allows the user to select what information is shared, such as audio, screen captures and notes on the call. The compliant call share function provides an email link to the recipient. When clicked, the link will direct the recipient to a hosted copy of the call recording where the recipient can playback the call. The link only provides temporary access to listen to the call, and the user can define how long that call will be available once shared. The user can set permissions to allow the recipient to add notes to the call and get notified if the recipient adds a note.
- Email enables a user to send the call’s details via email.
- Download allows a user to download the call in a non-encrypted audio format. An Admin User may configure which file format by clicking on the Settings > General Settings menu item and viewing the Company Settings -> Select Download Format section. When a user clicks on the Download item, a dialog will appear in which the logged in user may select as to where the call should be saved. Once the destination has been selected, the call downloads in the format as determined by the setting Select Download Format
- Download Part allows a user to select a segment within the call. Once the segment has been determined the user may download this segment in a non-encrypted audio format by clicking the ‘standalone’ download icon that appears. Should the user decide not to download part of the call, they may press the Cancel button. Once the call segment has been downloaded, to clear the selected segment the logged in user should click the Cancel button. An Admin User may config which file format by clicking on the Settings > General Settings menu item and viewing the Company Settings -> Select Download Format section.
- The Assigned To section displays the agent’s name the call recording is assigned to, their extension number, and email address. The user may reassign the call recording to another agent by clicking (RE-ASSIGN) . Doing so, will open a dialog pane in which the user may select the desired agent they wish to become associated with the call. Once reassigned, there will be no change to any historical records, except for the call recording the user has just reassigned. An example of this dialog is:
- The Call Info section describes information regarding the call’s recording, including the caller’s phone number, call duration and whether the call was incoming or outgoing.
- The Access Log illustrated by the icon is a complete audit trail describing which users have interacted with a call’s recording, and what interaction occurred. By clicking this icon, the user’s name is displayed, as well as the date and time each user used the playback feature, made a note, shared the call, or downloaded the call
- The Call Playback section allows a user to navigate directly to a portion of the call they would like to hear by clicking locations within the oscillogram.
- The recorded call’s oscillogram. The ‘top-half audio’ represents the first speaker, whilst the ‘bottom-half audio’ represents the second speaker.
- The user may pause the playback, select to ‘rewind’ 15 seconds by pressing the rewind icon or select to ‘fast forward’ 15 seconds by pressing the forward icon . The user may select the x2 icon to play the recording at twice the recorded speed.
- Speaker indicates when there is a change in speaker. Notice that the ‘bar’ takes on a darker color when the recording is in stereo.
- Single Notes allows the user to add numerous single notes pinned to a specific point in time in the call by clicking in the single notes bar. The point at which the note is added is indicated by the icon.
- The Notes Over Time section allows a user to add a note over a specific time period by clicking on the notes over time bar. The resulting icon indicating the ‘note over time’ is .
- The Screenshots section is where users are able to view any screenshots associated with the call.
NOTE: Screenshots are only available with CallCabinet’s Agent Client Installation and associated licensing. - The Quality Assurance section allows the user to view and perform a quality assurance evaluation whilst listening to the call. Quality Assurance evaluations are created under QA Scorecards in the Main Menu. If the user has an analytics license, then automatic QA is performed by CallCabinet, after the completion of the call. The report that is generated will appear under the Completed Evaluations as indicated by 22. The icon that is rendered under the QA Status column indicates whether the QA performed was a manual
, automatic or both . The user may view these evaluations by clicking on the ‘eye’ icon as indicated by 25. Should the logged in user not agree with the automated evaluation, they ‘override’ it by performing a manual evaluation. To do so the user clicks the edit icon associated with the evaluation they want to override, as indicated by 24. Quality Assurance evaluations are only available with CallCabinet’s Quality Assurance licensing, which incidentally is included in the Analytics License. - All available evaluation forms that may be selected for the current call to perform manual QA
- A list of all the completed evaluations, whether performed manually, and/or automatically.
- An indicator informing the user whether the evaluation form was generated automatically or manually .
- Edit the generated report.
- View the generated report.
- Once the logged in user selects the evaluation form, they would like to use from those available in the Available Evaluation Form list as indicated by 21, by checking the checkbox associated with the required evaluation form, they would then click the Begin Quality Assurance button. This will result in the evaluation form’s questions becoming rendered in the view. The logged in user may now proceed with the manual evaluation. An example of the questions being rendered once this button (26) is clicked is;
- The Visual Analytics card. This card visually displays a dashboard providing four metrics associated with the call currently being viewed. These are the Call Sentiment, Average Cadence, Interaction Word Cloud and Call Silence. Currently these are not customizable on this view.
- Call Sentiment. This graph displays changes in sentiment throughout the call highlighting both peaks and drops in sentiment, along with an average sentiment score for the call which in our example is 8%. Depending on the conversation, the overall sentiment of the call may be positive, neutral or negative. The sentiment scale ranges from -100 to +100, providing a clear overview of emotional trends during the conversation. Should the user hover their cursor over the line in the graph a ‘popup’ will appear rendering information associated with that datapoint.
-
- If the sentiment is in a pending state, the label Pending approval is displayed next to the Call Sentiment graph in the Visual Analytics section. Additionally, Pending approval appears beside the Show Sentiment checkbox in the Analysis Tools panel, and you can review the sentiments and analyze if the sentiments are positive or negative.

- If the sentiment is rejected, the graph is not displayed, and the Not approved is displayed instead. The Show Sentiment checkbox is disabled, and a Not approved message is displayed beside it.
 If the sentiment is approved, the graph is displayed in the Call Sentiment section, the Show Sentiment checkbox is enabled, and you can view the sentiment analysis.
If the sentiment is in a pending state, the label Pending approval is displayed next to Call Sentiment graph in the Visual Analytics section. Additionally, Pending approval appears beside the Show Sentiment checkbox in the Analysis Tools panel, and you can view the sentiments.

- If the sentiment is in a pending state, the label Pending approval is displayed next to the Call Sentiment graph in the Visual Analytics section. Additionally, Pending approval appears beside the Show Sentiment checkbox in the Analysis Tools panel, and you can review the sentiments and analyze if the sentiments are positive or negative.
-
- Average Cadence: This graph illustrates the ‘speed of the conversation’ or ‘words per minute’ (wpm) at various intervals of the call. The average call cadence is also illustrated in the graph. There are three variations in speech rate (https://www.prezent.ai/zenpedia/words-per-minutespeech):
-
- slow pace (around 100-120 wpm),
- normal pace (around 130-160 wpm), and
- fast pace (around 170-200 wpm).
According to the National Center for Voice and Speech, the average conversation rate for English speakers in the United States is about 150 wpm.
The average speaking rate will vary depending on the activity, for example: (https://virtualspeech.com/blog/average-speaking-ratewords-per-minute) -
- Presentations: between 100-150 wpm for a comfortable pace
- Conversational: between 120-150 wpm
- Radio hosts and podcasters: between 150-160 wpm
Word cadence should be from 140 to 180 words per minute. High words per minute usually indicates poor communication, whereas low words per minute indicates a possible issue, for instance unable to answer a customer’s question. This card also displays the average words per minute. In our example it is 155 wpm.
- Interaction Word Cloud: This provides a visual representation of words contained within the conversation. The larger and bolder a word appears in the visual, implies that it is used more often in the conversation and therefore likely to be more important than the other words in the cluster of words.
- Call Silence: This visual provides insight into the silence periods within a call, which includes placing a customer on hold. This helps identify moments of inactivity and their potential impact on the flow of the conversation. Monitoring silence is important as it can reveal important insights into communication dynamics, emotional undertones, and the quality of interactions. An example would be identifying a high level of silence during a conversation. This is unproductive and could potentially lead to low customer satisfaction and increased customer frustration. Additionally, high levels of silence should trigger the need for a supervisor to explore the root causes, which could be:
- Poor agent knowledge which requires training.
- Slow and inefficient systems resulting in agents waiting for system response, for example poor network quality, lag, or dropped signals.
- Agents need to navigate between multiple applications to find the desired answers.
- Agents are not supplied with a Single Pane of Glass view to the information or systems they require information from to conduct their roles efficiently.
- Silence may arise from emotional reactions like anxiety, tension, or discomfort. For example, if the conversation covers sensitive or contentious topics, one party may hesitate or refrain from speaking due to unease or fear of conflict.
- When a conversation involves complex information, problem-solving, or decision-making, a participant may need time to process information, think critically, or decide how to respond, which leads to prolonged periods of silence.
This card also displays the average call silence. In our example it is 2%.
- The AI Generated Summary section is automatically generated and displays a summary of the call. See the explanation below.
- The transcript section is automatically generated and displays a transcript. See the explanation below.
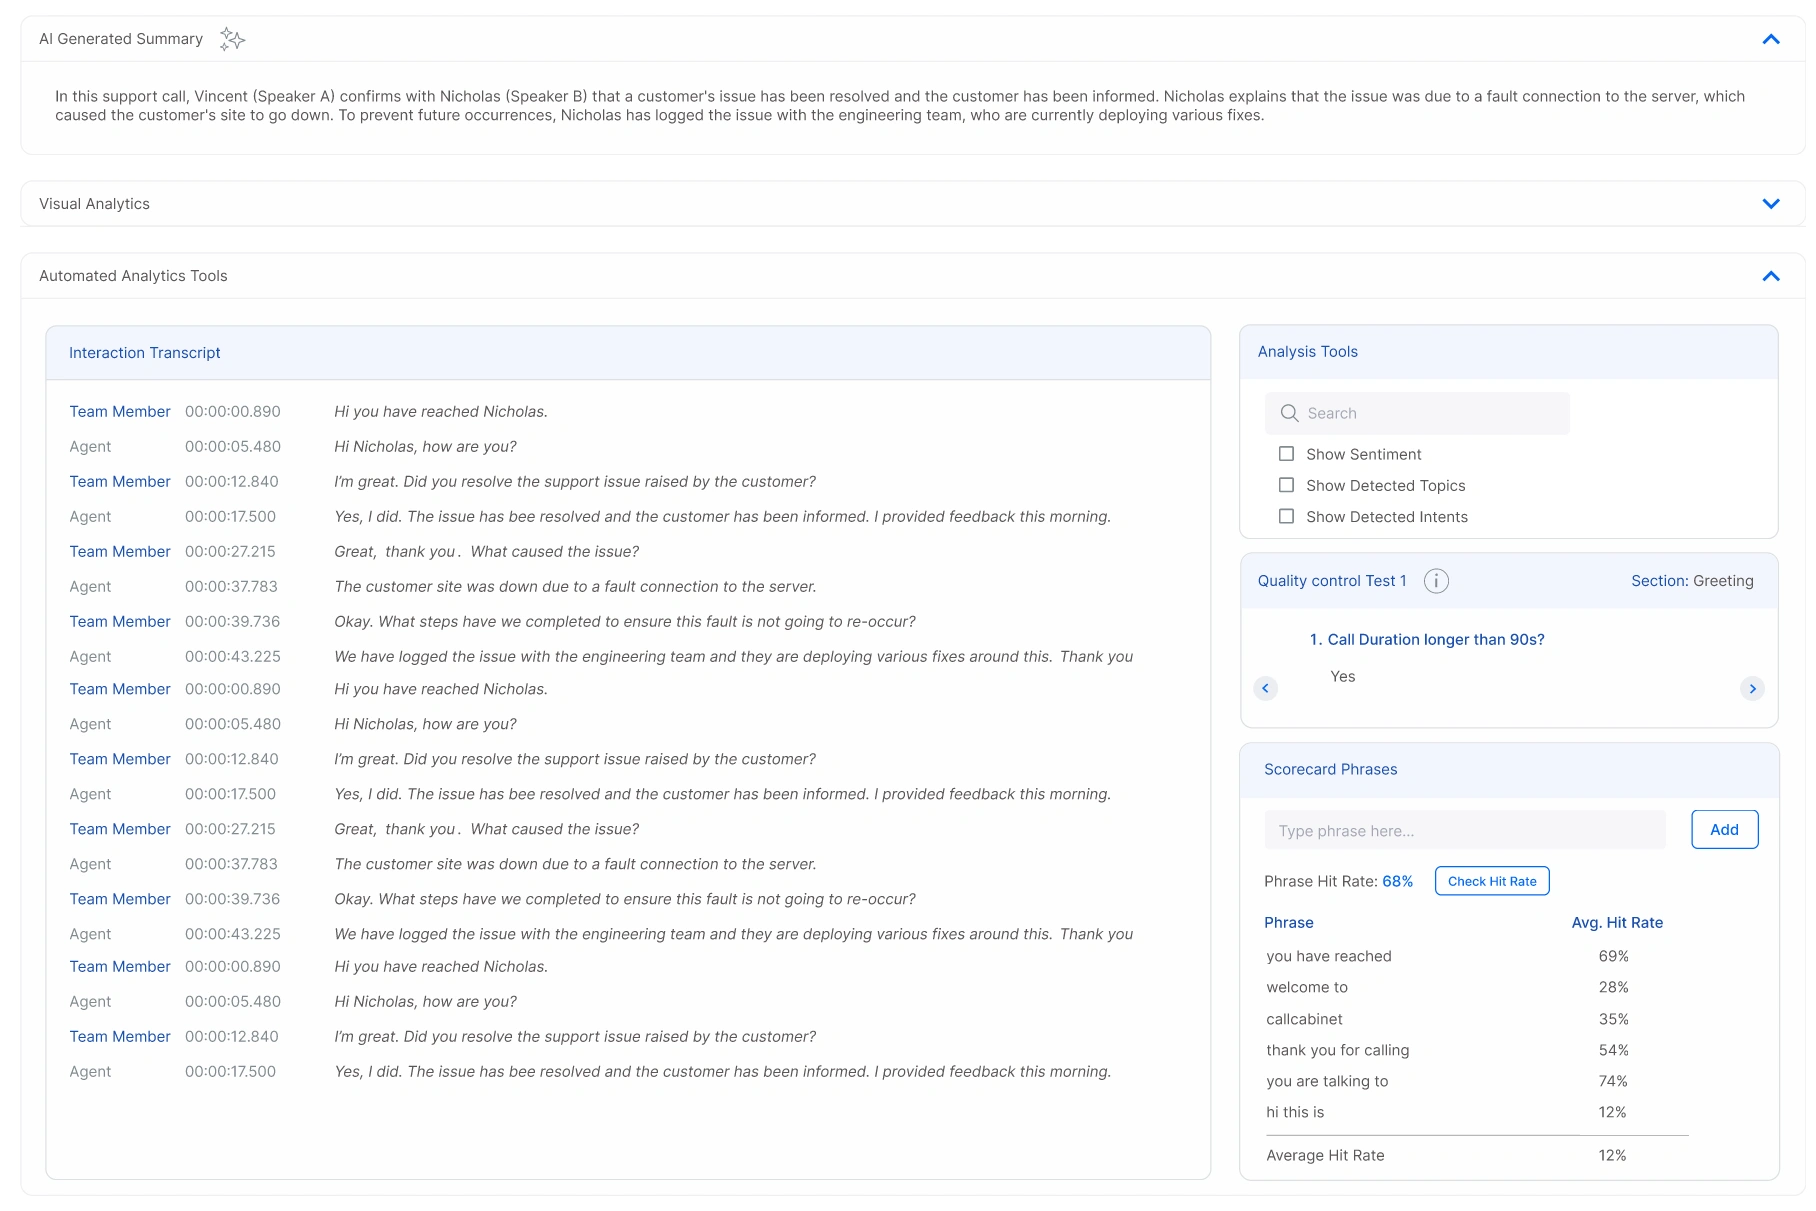
Figure – Transcription and Analytics
The explanation following relates to the image Figure – Transcription and Analytics. The AI generated Summary and Automated Analytics Tools is probably the most important part of this view.
The AI generated summary provides a succinct summary of the conversation that occurred. This is very useful in providing the context of the conversation.
The user may read the actual transcript under the Interaction Transcript section. Here the conversation is divided up between two parties; the team member/customer(s) and the agent.
A Copy Transcription button allows users to copy the full call transcript to their clipboard with a single click, making it easy to share or document the entire conversation.
The user is able to search the call by typing the word or phrase they are wanting to locate in the conversation in the search box illustrated in the Analysis Tools card. For example, should the user type thank you, then all occurrences of this will be ‘highlighted’ in the transcript as well as how many occurrences were discovered. This is illustrated below with blue boxes. The arrows facilitate navigation between occurrences of the searched term, with the view automatically scrolling to each instance.
Should the user want to look at the sentiment of the conversation, they may check the Show Sentiment checkbox found in the Analysis Tools card. This will result in the highlighting of both positive and negative sentiments that may have occurred during the conversation. This is illustrated in the image below. The red highlighted text amplifies the negative sentiment whereas the green text the positive sentiment.
In a similar fashion should the user want to view any detected topics or Intents that have been mentioned in the conversation, all they need to do is check the respective checkbox in the Analytics Tools card. For example; Here the detected topics are underlined in purple, whereas the detected Intents, or action points are underlined in blue.
Should the user hover their cursor over any of the underlined topics or intents, then the actual topic or intent is ‘popped up’. For Example, when hovering over the detected topic ‘fault connection to the server’ the topic this relates to is ‘Product Fault’;

NOTE: For some calls only few Analytics Tools checkboxes are available. For instance, only Show Detected Topics and Show Detected Intentions and not Show Sentiment. The reason for this is: If there is insufficient sentiment data, the Show Sentiment checkbox will not be available as there is nothing to display. The same applies to the other two Analytics tools checkboxes (Show Detected Topics and Show Detected Intentions) as well as any Analytics features on the Call Details page.
Referring to Figure – Transcription and Analytics, the Quality Control card will render the scorecard that is selected (highlighted) under the Completed Evaluations card, indicated by 22 in Figure – Call Details with Quality Assurance and Analytics once selected the user will immediately be able to see what the result for the question is as related to this conversation. If the user discovers that the question was marked wrong, when in fact it is correct as the words used in the transcript do not appear in the current word pack, the user may add the words to the word pack associated with the question. To do this the user would go to the Scorecard Phrases card and enter the phrase in the word phrase text field. Once done the user would click the add button, thereby applying the new phase to the pack for the question. Notice that in the Scorecard Phrases card, a percentage of average hit rate of all the question’s word phrases across all calls that have been evaluated. This gives feedback as to how effective the various phrases are. A high average hit rate suggests the phrase is valuable and may be beneficial to incorporate into the scorecard configuration for future evaluations.
NOTE: The hit rate calculation considers phrases entered from the time of input onwards.
Using the AI Agent in the Call Listing and Call Details pages
CallCabinet employs an AI Agent and is a core feature currently available within all pages. This AI Agent allows users to interact with data through natural language queries across all call records, with the added option to apply filters. The AI Agent processes the query using an advanced model to identify the most relevant calls and then leverages a large language model to generate a concise, summarized response. Users may further refine their results by applying filters, which help increase the accuracy of the response.
A user may ‘activate’ the AI Agent by clicking on the AI Agent icon, located in the top right-hand side, illustrated by 1 in Figure – Activate AI Agent. When the user does this, a ‘floating button’ appears, illustrated by 2 and a Chat Dialog appears, as illustrated by 3, in which they are able to ‘chat with the AI Agent’ asking questions in connection with all the recorded calls. To ‘shrink’ the chat dialog, the user clicks the ‘floating button’, illustrated by 2. To ‘expand’ the chat dialog, the user clicks the ‘floating button’ once again, revealing the chat dialog, illustrated by 3. To remove this floating ‘pop-up’ button and turn off the AI Agent, the user clicks on the AI Agent icon once again, illustrated by 1, resulting in the floating ‘pop-up’ button, illustrated by 2, and Chat Dialog, as illustrated by 3, disappearing.

Figure – Activate AI Agent
When, in the Call Listing page as illustrated in Figure – Activate AI Agent, the user may interact with the AI Agent, via the Agent Chat dialog asking the AI Agent any question relating to the user’s CallCabinet account they wish. In the ‘Ask AI Agent’ field, illustrated by 4, the user would enter the question, for example: ‘What is the sentiment’ or ‘Did the agent introduce themselves in a friendly manner’, and then click the Send button, illustrated by 5. The AI Agent, after a few moments, will respond with the answer in the text area illustrated by 6. The user may continue asking any questions relating to their calls and CallCabinet account and the AI Agent will respond by appending the answers in the text area illustrated by 6. Should the user want to re-start the conversation, they may clear all previous interactions, by clicking on the ‘Start New Conversation’ button illustrated by 7. This will result in the text area, illustrated by 6, being reset and cleared.
It is possible for the user to ask questions about a specific call or calls. To do this, the user would click the checkbox associated with the call or calls, illustrated by 8, they would like the AI Agent to use as its source when answering any questions the user asks. A maximum of 10 calls may be selected. The answers will appear in the text area, illustrated by 6.
Figure – Activate AI Agent illustrates the agent in the Call Listing page. Should a user decide to apply any filters in the Call Listing page, then the AI Agent will ‘honor’ these filters by taking them into account when answering a user’s questions. The user is therefore able to ‘narrow’ down the calls the AI Agent interrogates by not only allotting any call or calls the user may have selected by means of the ‘bulk check-box’, but by also applying the filters and associated criteria the user may have applied.

Figure – AI Agent Call Details
When a user views a call in its Call Details page, then any questions the user asks the AI Agent will be specific to that call itself. The process of asking the AI Agent questions is the same as described when the user is in the Call Listing page. If the agent has been ‘activated’ in the Call Listing page, then it will be automatically available in the Call Details page. If it is not activated, then the user must ‘activate’ the AI Agent by clicking on the AI Agent icon, located in the top right-hand side, illustrated by 1 in Figure – AI Agent Call Details. When the user does this, a ‘floating button’ appears, illustrated by 2, and a Chat Dialog appears, as illustrated by 3, in which they are able to ‘chat with the AI Agent’ asking questions in connection with the call in the current Call Details page.
The user may interact with the AI Agent, via the Agent Chat dialog asking the AI Agent any question relating to the call. In the ‘Ask AI Agent’ field, illustrated by 4 in Figure – AI Agent Call Details, the user enters the question, for example: ‘What is the sentiment for this call’ or ‘Did the agent introduce themselves in a friendly manner’, and then click the Send button, illustrated by 5. The AI Agent, after a few moments, will respond with the answer in the text area illustrated by 7. The user may continue asking any questions relating to the call and the AI Agent will respond by appending the answers in the text area illustrated by 7. Should the user want to re-start the conversation, they may clear all previous interactions, by clicking on the ‘Start New Conversation’ button illustrated by 6. This will result in the text area, illustrated by 7, being reset and cleared.
In summary, the AI Agent is applied to a single call when in the Call Details page, however, when in the Call Listing page, the AI Agent is applied to all calls (or selected calls) and filters when answering user queries.
NOTE: A user may interact with the AI Agent on any page the ‘floating button’ appears.
Chat Listing
The Chat Listing page allows users to search, view, and manage chat conversations stored in the CallCabinet system. Each row in the listing represents an individual chat session, showing key details such as the chat date, name, participants, chat type, and associated site. Users can filter and locate specific chats using the search bar, and take various actions like viewing chat content, downloading, or exporting chat data. This page serves as the central workspace for reviewing and accessing chat records and will likely be used frequently by most users.
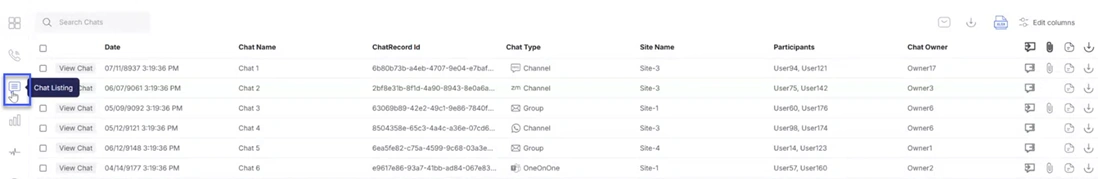
The Chat Listing page displays the following columns in the table:
- View Chat: Opens the selected chat conversation for detailed viewing.
- Date: Indicates the timestamp when the chat occurred.
- Chat Name: Indicates the title or identifier of the chat session.
- ChatRecord Id: Indicates a unique system-generated ID for the chat record.
- Chat Type: Indicates the chat format, such as Channel, Group, or One-on-One.
- Site Name: Indicates the location or site associated with the chat.
- Participants: Indicates the list of all users who took part in the chat.
- Chat Owner: Indicates the user responsible for or who initiated the chat.
- Actions (Icons): Provides quick access to options such as adding notes and downloading a chat conversation. The following options are displayed:
- Is Internal Chat: Indicates whether the chat is internal.
- Has Attachment: Displays if the chat contains any attachments.
- Notes: Allows you to add or view notes related to the chat.
- Download: Enables you to download the chat conversation.
Each column in the data table can be sorted by clicking its column name. To filter a column, click the ‘filter icon’ ![]() next to the column header.
next to the column header.
NOTE: The default column filter option is Starts With, which helps users quickly narrow down results based on values that begin with the entered characters. This filter is applicable only to text-based columns. For non-text columns such as dates or durations, the default filter does not apply.
The following bulk action options are available on the Chat Listing page:
- Email Chats: Allows you to email multiple chat conversations to selected users.
- Download: Allows you to download multiple chat conversations at once.
- Export List Results: Allows you to export the list of chat conversations to an Excel file.
Searching Chats
You can use the Search Chats bar to search for specific keywords within the chat records.
To search for keywords in chats:
- Navigate to the Chat Listing page.
- Enter the desired keyword or phrase into the Search Chats bar at the top. For example, if you search a keyword hi, all the results matching the entered keyword (hi) is filtered and displayed in the listing.
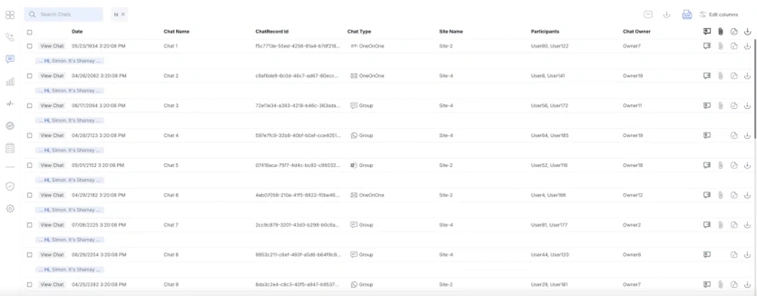
Viewing a Chat
The Chat Listing page allows you to view detailed information about individual chat conversations stored in the system.
To view a chat:
- Navigate to the Chat Listing page.
- Click the View Chat icon next to the desired chat record.
A side panel opens displaying the full chat transcript.
In the chat view panel, you can:
- Browse the messages, replies, and timestamps.
- View attachments, including images, videos, and other files.
- Use the Search Inbox to search for specific keywords or content within the chat.
Performing Actions on a Chat Conversation
You can perform few actions on an individual conversation, such as adding a note or downloading a chat conversation.
Adding a Note
Notes allow users to add relevant context or important details to a chat conversation. These notes help provide clarity during reviews and can be used for documentation, compliance, or internal reference purposes.
To add a call note:
- On the Chat Listing page, locate the chat for which you wish to add a note.
- Click the Notes icon.
- In the Notes wizard, enter the note that you wish to add.

- Click Save.
A Note added successfully message is displayed.
Editing a Note
You can edit an existing note that has already been added.
To edit a note:
- On the Chat Listing page, locate the chat for which you want to edit a note.
- Click the Notes icon.
- In the Notes wizard, click Edit and update the note content as needed.

- Click Save.
A Note edited successfully message is displayed.
Deleting a Note
If a note added to a chat conversation is no longer relevant, you can easily delete it from the system. Deleting a note helps maintain accurate and up-to-date records for future reference.
To delete a note:
- On the Chat Listing page, locate the chat for which you want to delete the note.
- Click the Notes icon.
- In the Notes wizard, click the Delete icon.
Downloading a Chat Conversation
You can download a chat conversation from the Chat Listing page for offline reference, audit, or record-keeping purposes. The downloaded file typically contains the full chat transcript, including messages, timestamps, and any attachments.
To download a chat conversation:
- On the Chat Listing page, locate the chat you want to download.
- Click the Download icon associated with that chat.
- The chat conversation will be downloaded to your device.
Performing Bulk Actions
You can perform bulk actions such as exporting to Excel, emailing, and downloading a chat conversation on multiple chat conversations simultaneously.
Emailing Chat Conversations
You can email multiple chat conversations to selected users.
To email chat conversations:
- On the Chat Listing page, select the chats you want to email.
- Click the Email icon.

- In the Email Chat to field, enter the email addresses of the users whom you wish to share the chat conversations.
- Click Send.
Downloading Multiple Chat Conversations
You can download multiple chat conversations at once.
To download multiple chat conversations:
- On the Chat Listing page, select the chats you want to email.
- Click the Download icon.

The selected chat conversations are downloaded.
Exporting Chat Conversations
You can export the list of chat conversations to an Excel file.
To export chat conversations:
- On the Chat Listing page, select the chats you want to export.
- Click the Export List Results icon.
The chat conversations are exported into an Excel file.
Reporting
The Reporting Page is where a user generates reports. Calls included in the reports are only the calls that have been recorded.
NOTE: An Advanced User License, Quality Assurance Analyst License or Quality Assurance Admin License is required to access the Reporting page.
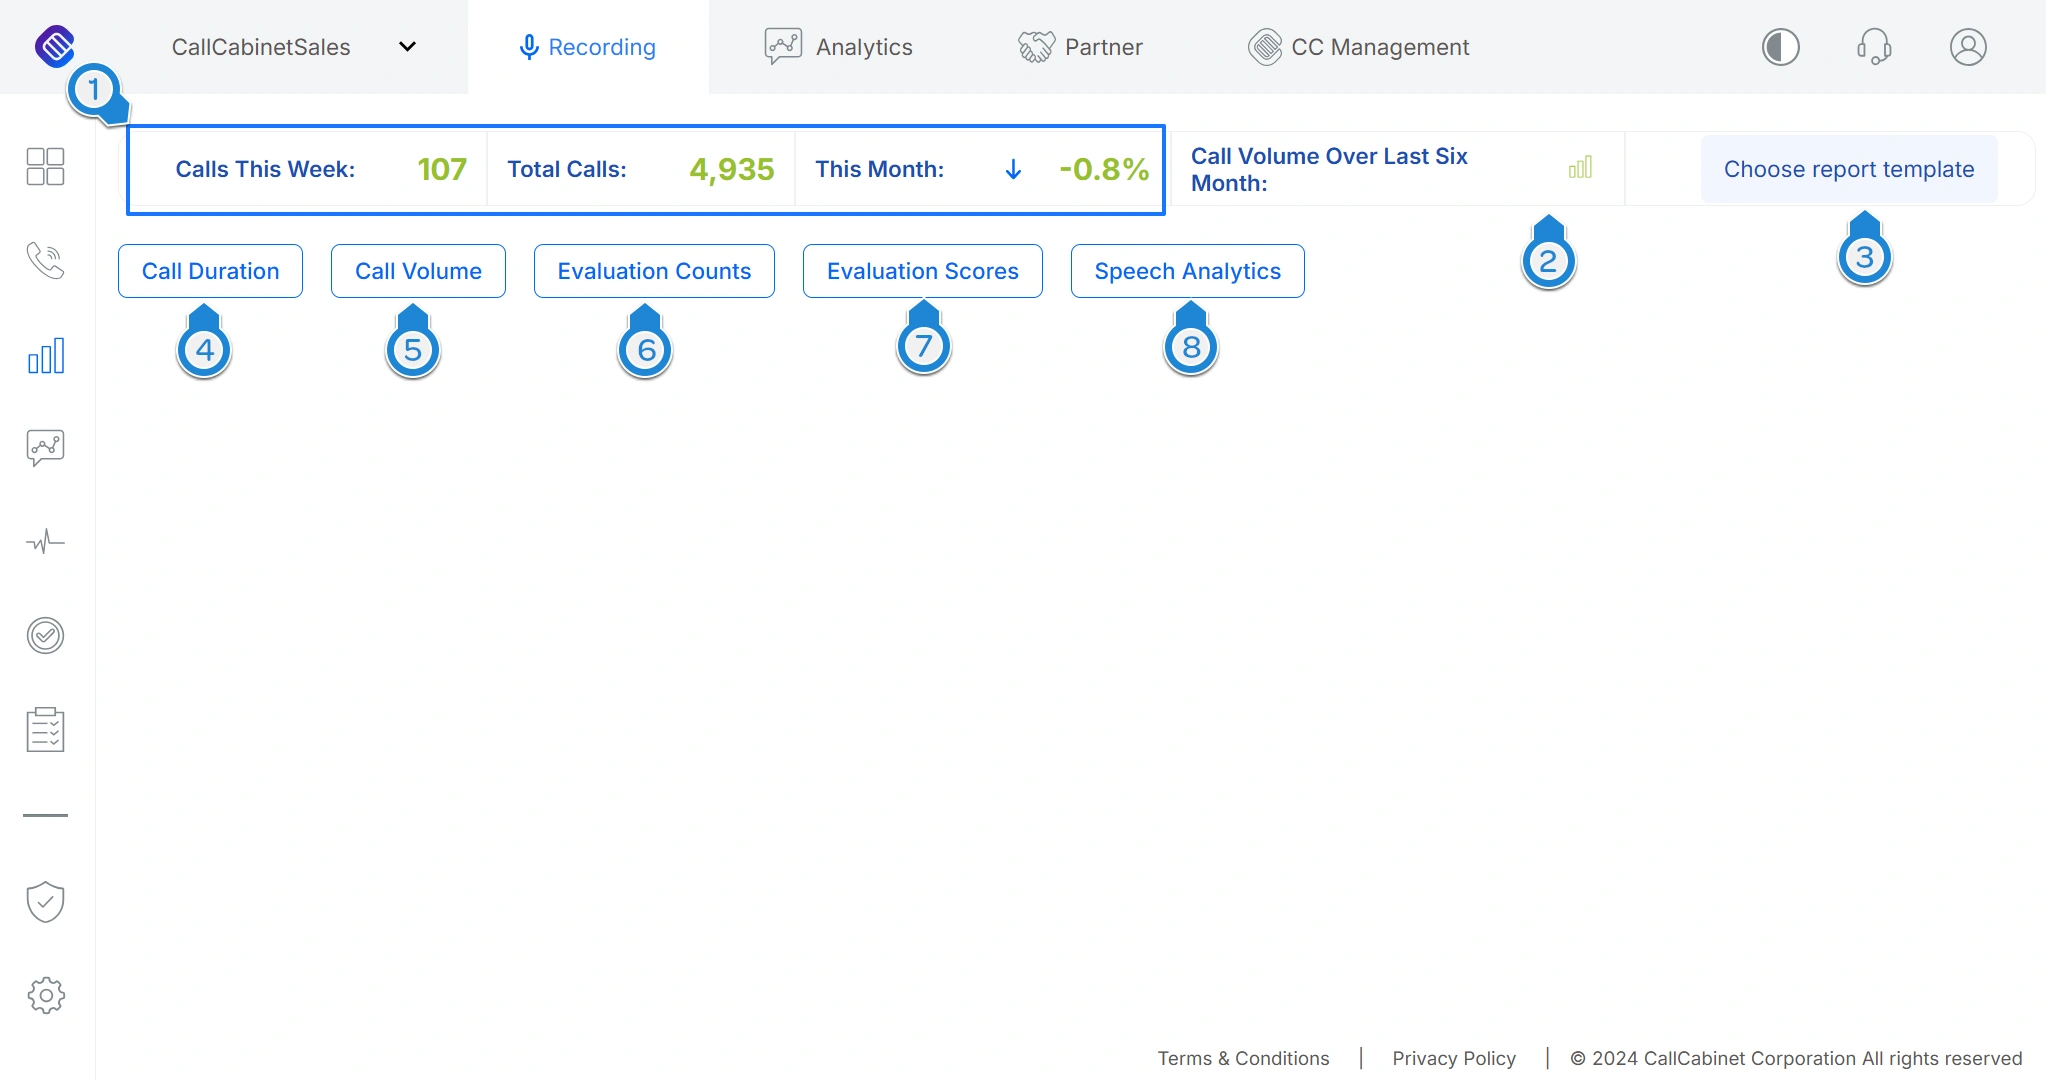
Figure – Reporting Default Page
The numbers in the discussion below relate to the image in Figure – Reporting Default Page:
- The Calls Summary section displays the number of Calls This Week, the Total Calls number of recorded calls to date, and the percentage number of calls This Month as compared to the same period last month.
- The Calls Volume section renders a bar chart displaying the call volume over the past six months. To see this chart, click on the
 icon. An example of this graph being rendered is;
- The Choose report template button renders a list of previously saved report templates, when clicked. When generating a report users have the option to save the report’s template that they may reuse. Once saved, it will appear in a dropdown list. If a user is going to continually generate a report based on the same parameters/criteria, they may create their own template based on one of the five reports. To run a saved report a user would click Choose report template button and then select the report template’s name visible in the list. An example of this dropdown template report list is;

Incidentally, the user may search for a saved template by typing their request in the Search Reports search field. For example;

- A Call Duration Report allows a user to pull data associated with call durations. For example, if the user wishes to evaluate how much time agents are spending on calls daily, the user would pull a Call Duration Report using the criteria: by agent, by day.
- A Call Volume Report pulls data associated with call volumes. For example, if the user wishes to evaluate how many incoming calls occurred on a particular extension each day, the user would pull a Call Volume Report using the criteria: extension by day.
- An Evaluation Counts Report allows a user to generate reports based on quality assurance evaluations. Quality assurance evaluation reporting is only possible with CallCabinet’s Quality Assurance (QA) license.
- An Evaluation Scores Report will pull reports based on quality assurance evaluation scores. Quality assurance evaluation reporting is only possible with CallCabinet’s Quality Assurance (QA) license.
- A Speech Analytics Report will create reports based on call insights, such as call sentiment. Speech Analytics Reporting is only possible with CallCabinet’s Analytics (QA) license.
Generating a Report
NOTE: An Advanced User License, Administrative User Role, Quality Assurance Analyst License or Quality Assurance Admin License is required to access the Reporting Page. The main reporting page presents the user with the reports that may be generated. Once a user has selected the type of report they would like to view, the user is required to define the report criteria. For example, if a user is pulling a call duration report, the first input criteria would be to ask: how does the user want to evaluate their call duration? By day, by day of the month, by month, by month of year, by agent by day, by agent by day of the month, by agent by month, by agent by month of year, by extension by day, by extension by day of the month, by extension by month, by extension by month of year. This is illustrated in Figure – Select Report Period.
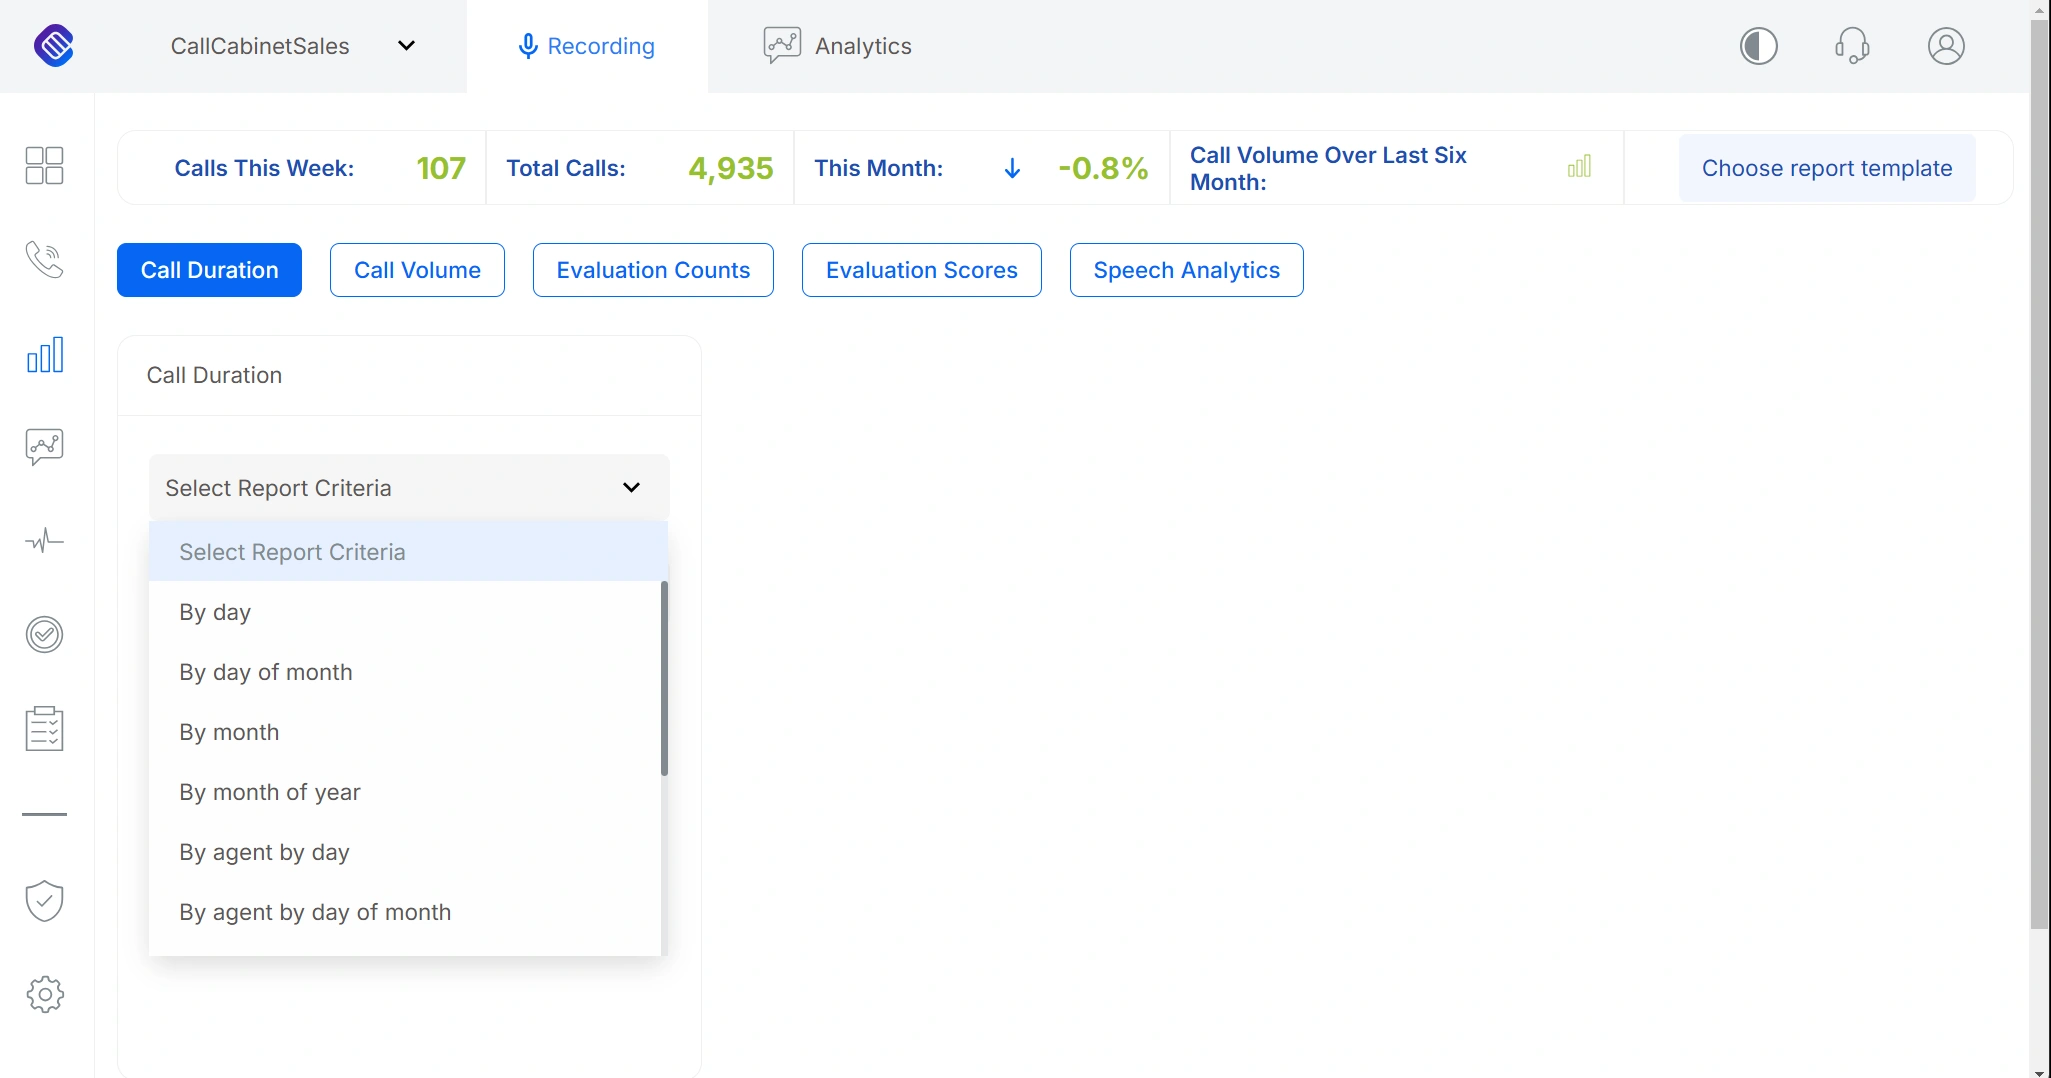
Figure – Select Report Period
Once the user has defined the initial criteria, the select report field will become visible, prompting the user to select a time period for the report: all dates, custom dates, today, yesterday, this week and last week, this month to date, last month, this year, this year to date and last year, as illustrated in Figure – Report Time Period.
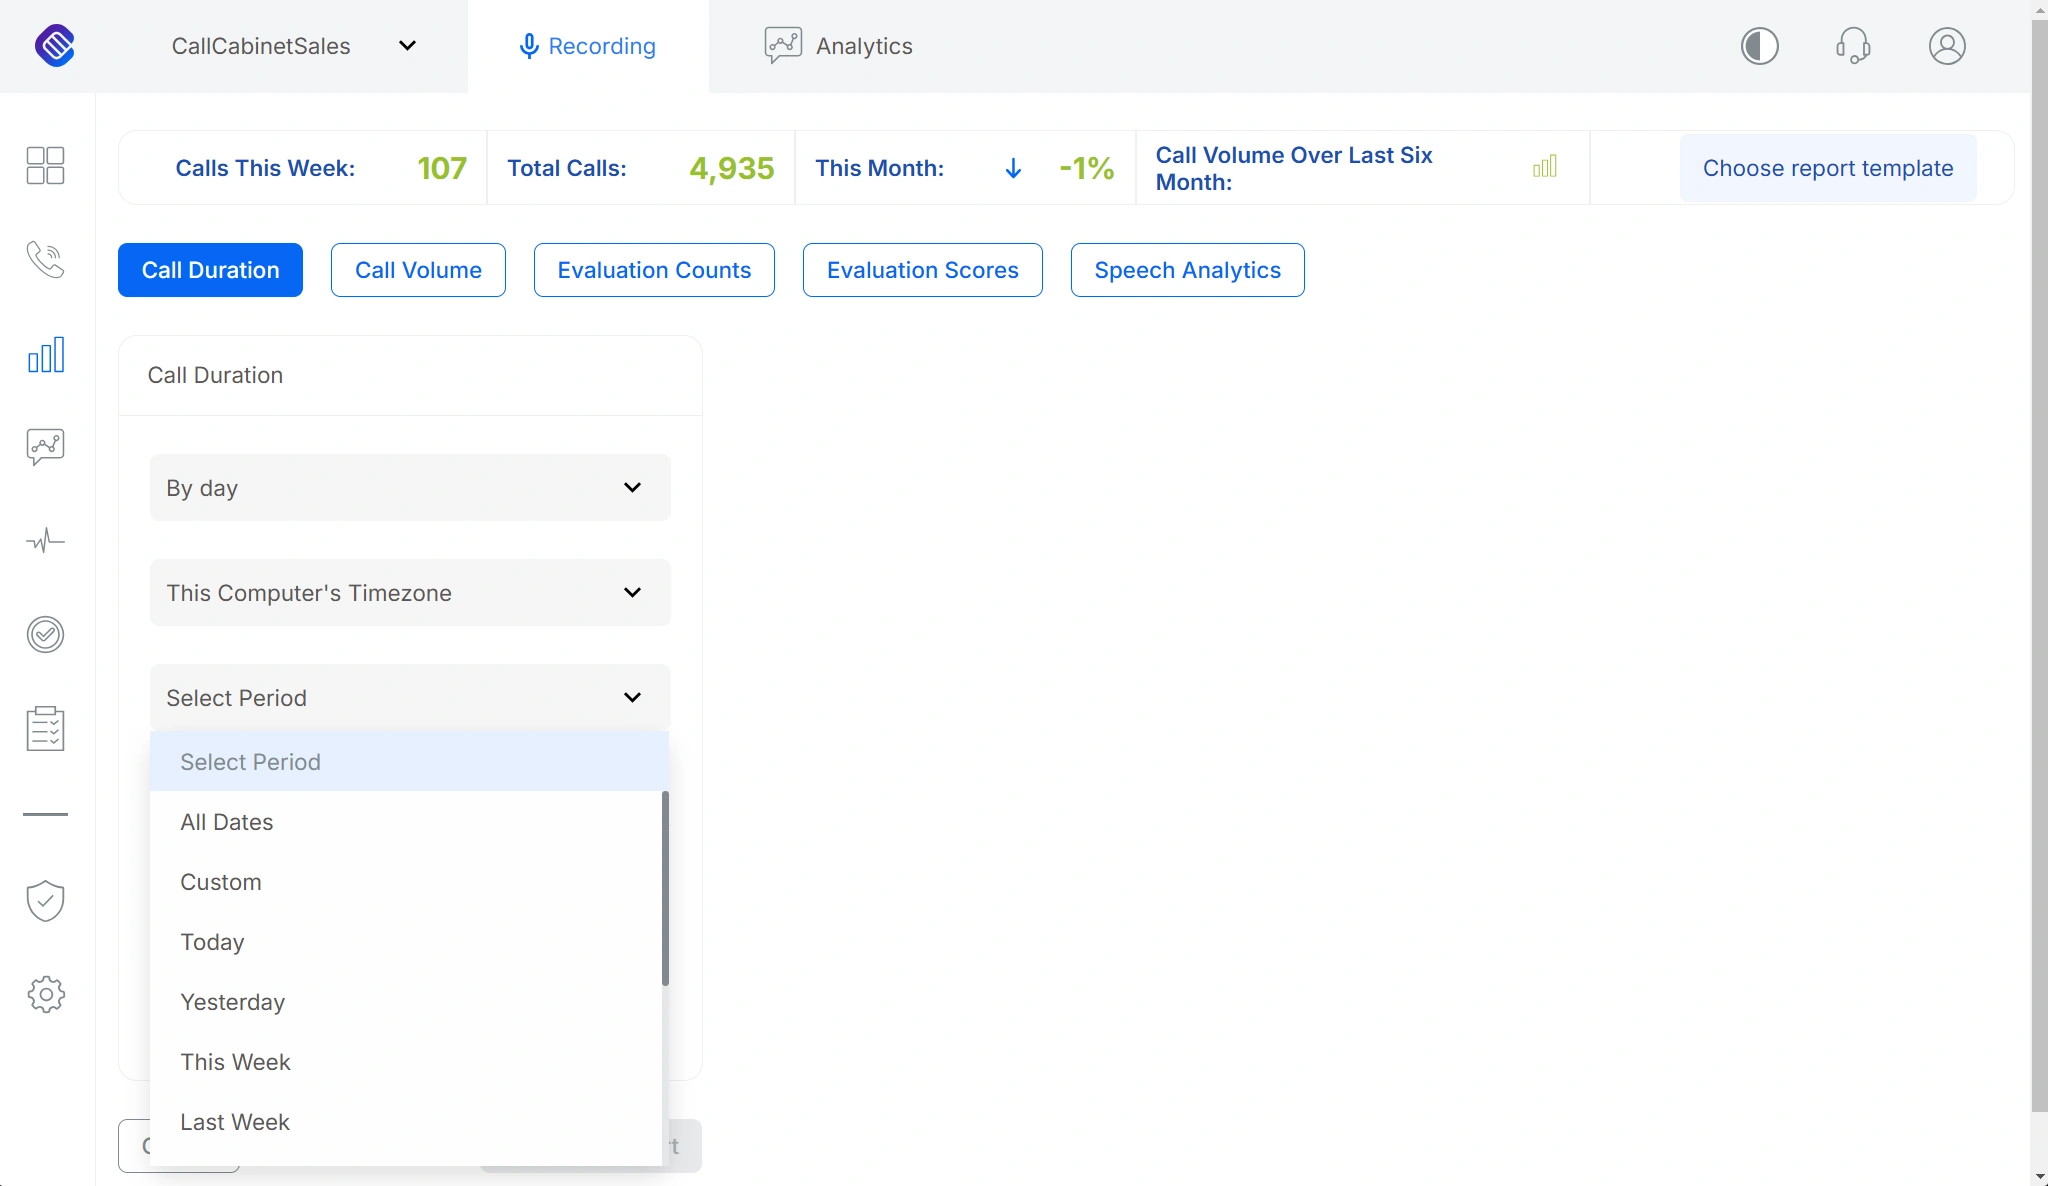
Figure – Report Time Period
After selecting the initial report criteria and defined time period, the user will be prompted to select chart values to display, inter alia, internal and/or external calls, which agents and/or extensions they would like to include in the report. This is illustrated in Figure – Select Call Direction, Agents and Extensions.
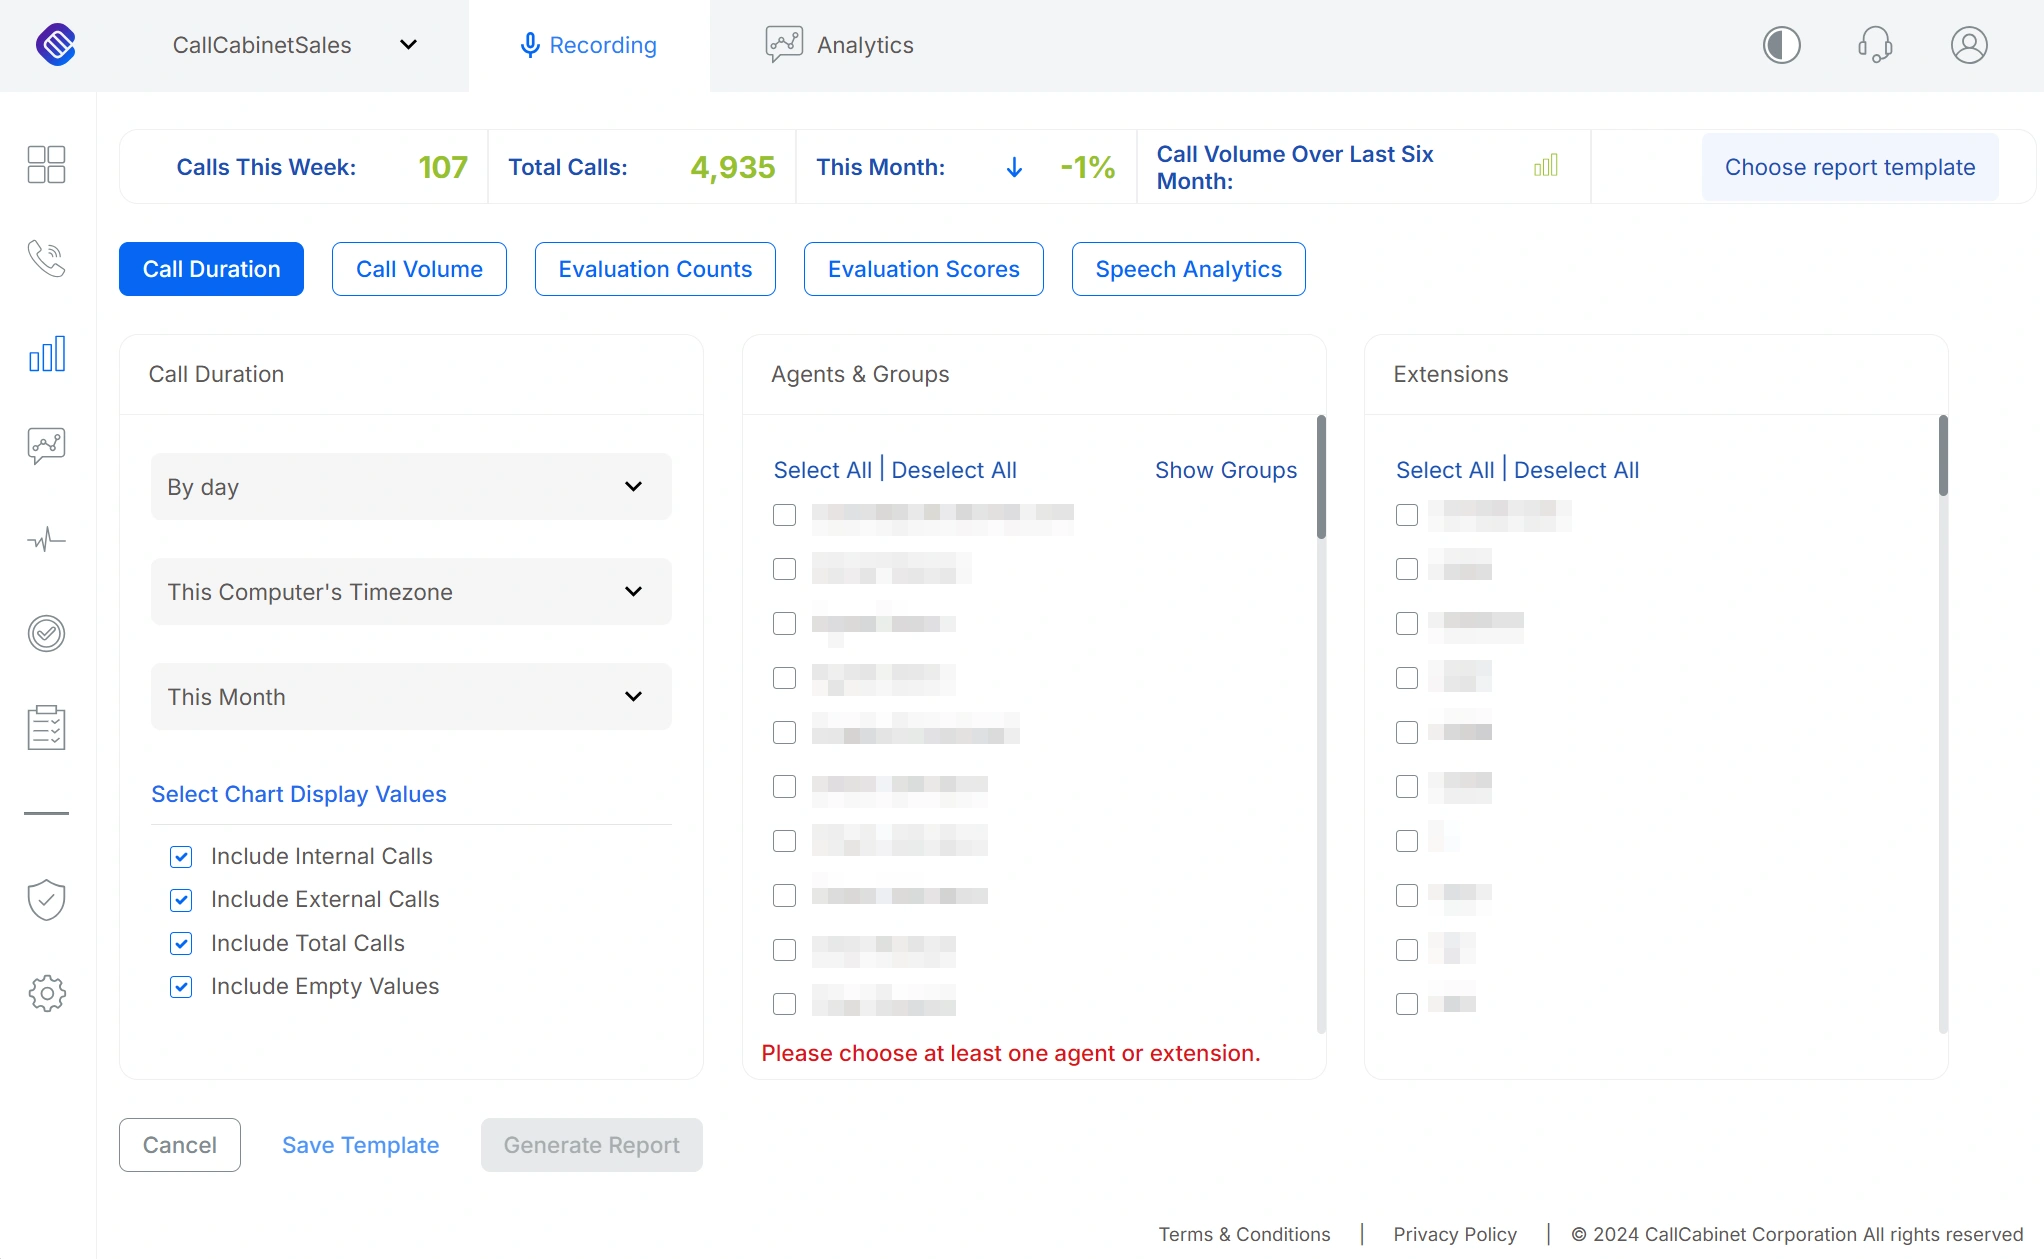
Figure – Select Call Direction, Agents and Extensions
Once the user has selected everything they would like to appear on the report, the Generate Report button is enabled. This process is illustrated in Figure – Completed Call Direction, Agents and Extensions.
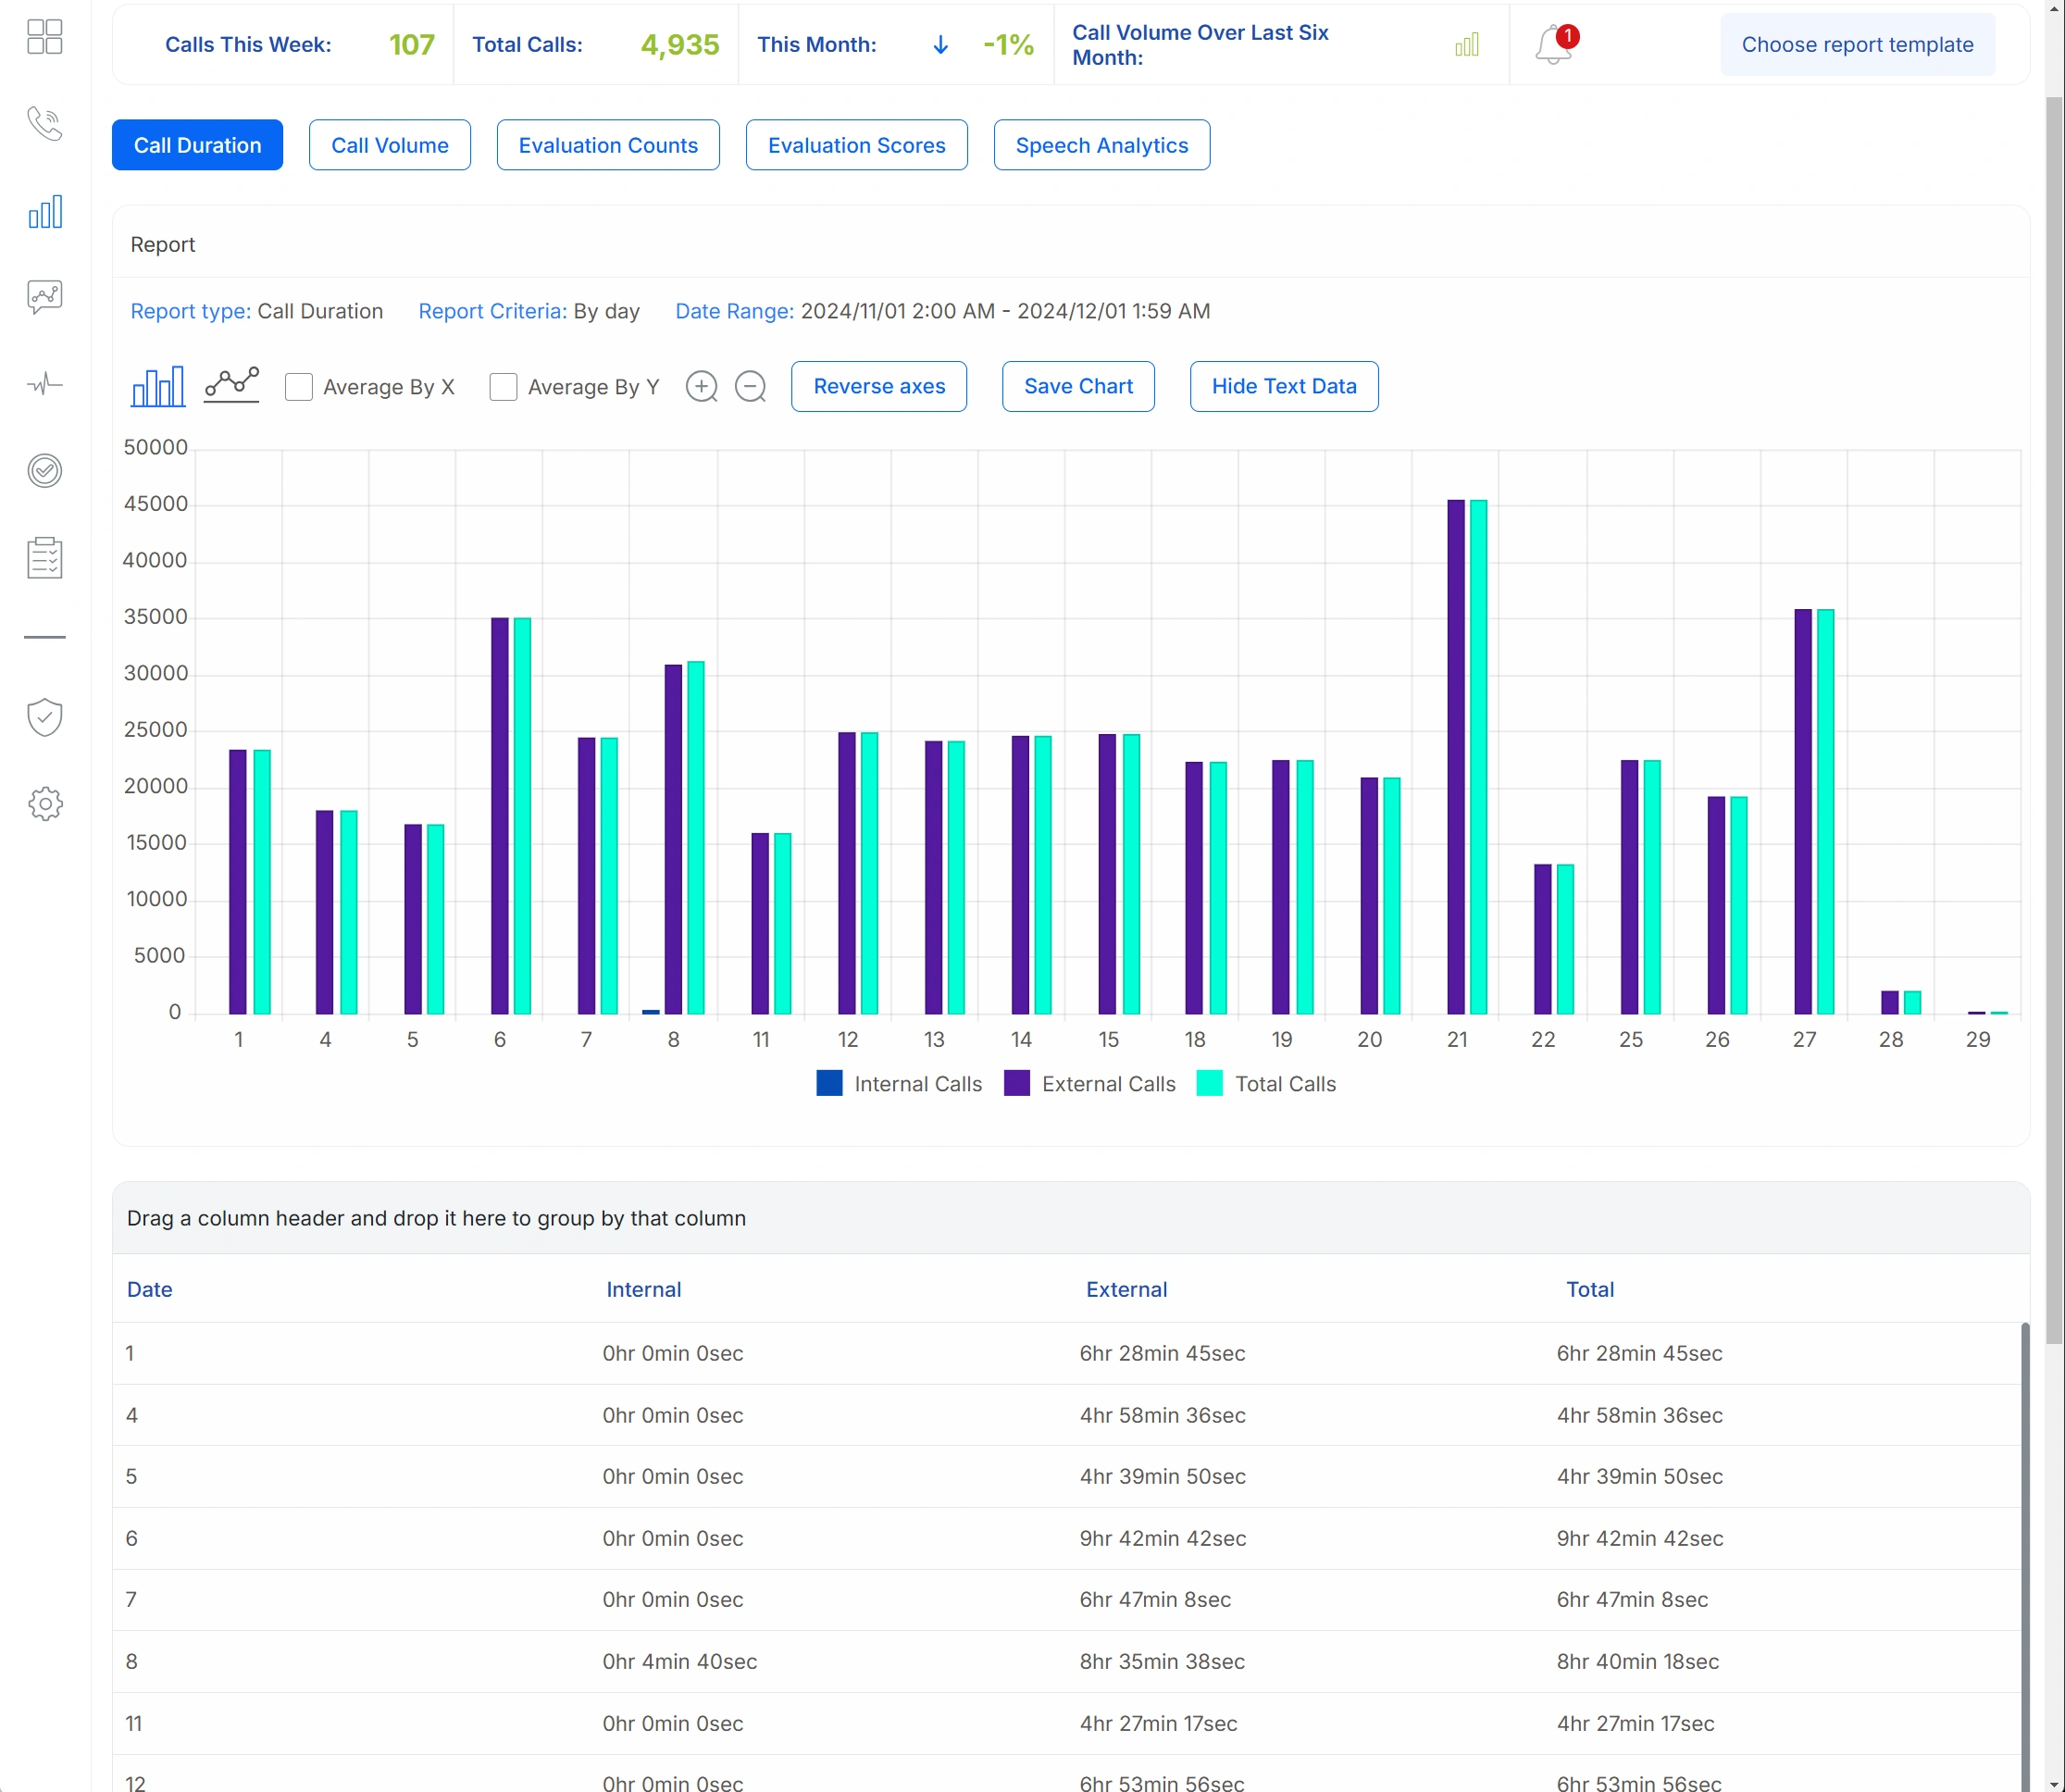
Figure – Report
By clicking on the Generate Report button the required report is generated and will display information in both an infographic and a data table format, both of which can be downloaded or directly to the user’s desktop. Figure – Report is an example of a report infographic. Depending on the user’s preference, the report can be displayed in either a bar graph or line chart.
Depending upon the type of report a user chooses, they will have different options as to how to view the data. For instance, Bar Graphs, Pie Charts, Line Charts as well as average scoring on the X or Y axes. The user may also reverse the axes to change the horizontal and vertical descriptions. To export the data table to Excel the user would click on the ![]() icon at the bottom of the table.
icon at the bottom of the table.
Heartbeats
Heartbeats are a visual indication of the health of the system. Essentially this provides information about when last the Agent Client or Desktop Recorder installs responded.
Client Heartbeats
NOTE: An Advanced User License, Administrative User role, Quality Assurance Analyst License or Quality Assurance Admin License is needed to access the Client Heartbeats page.
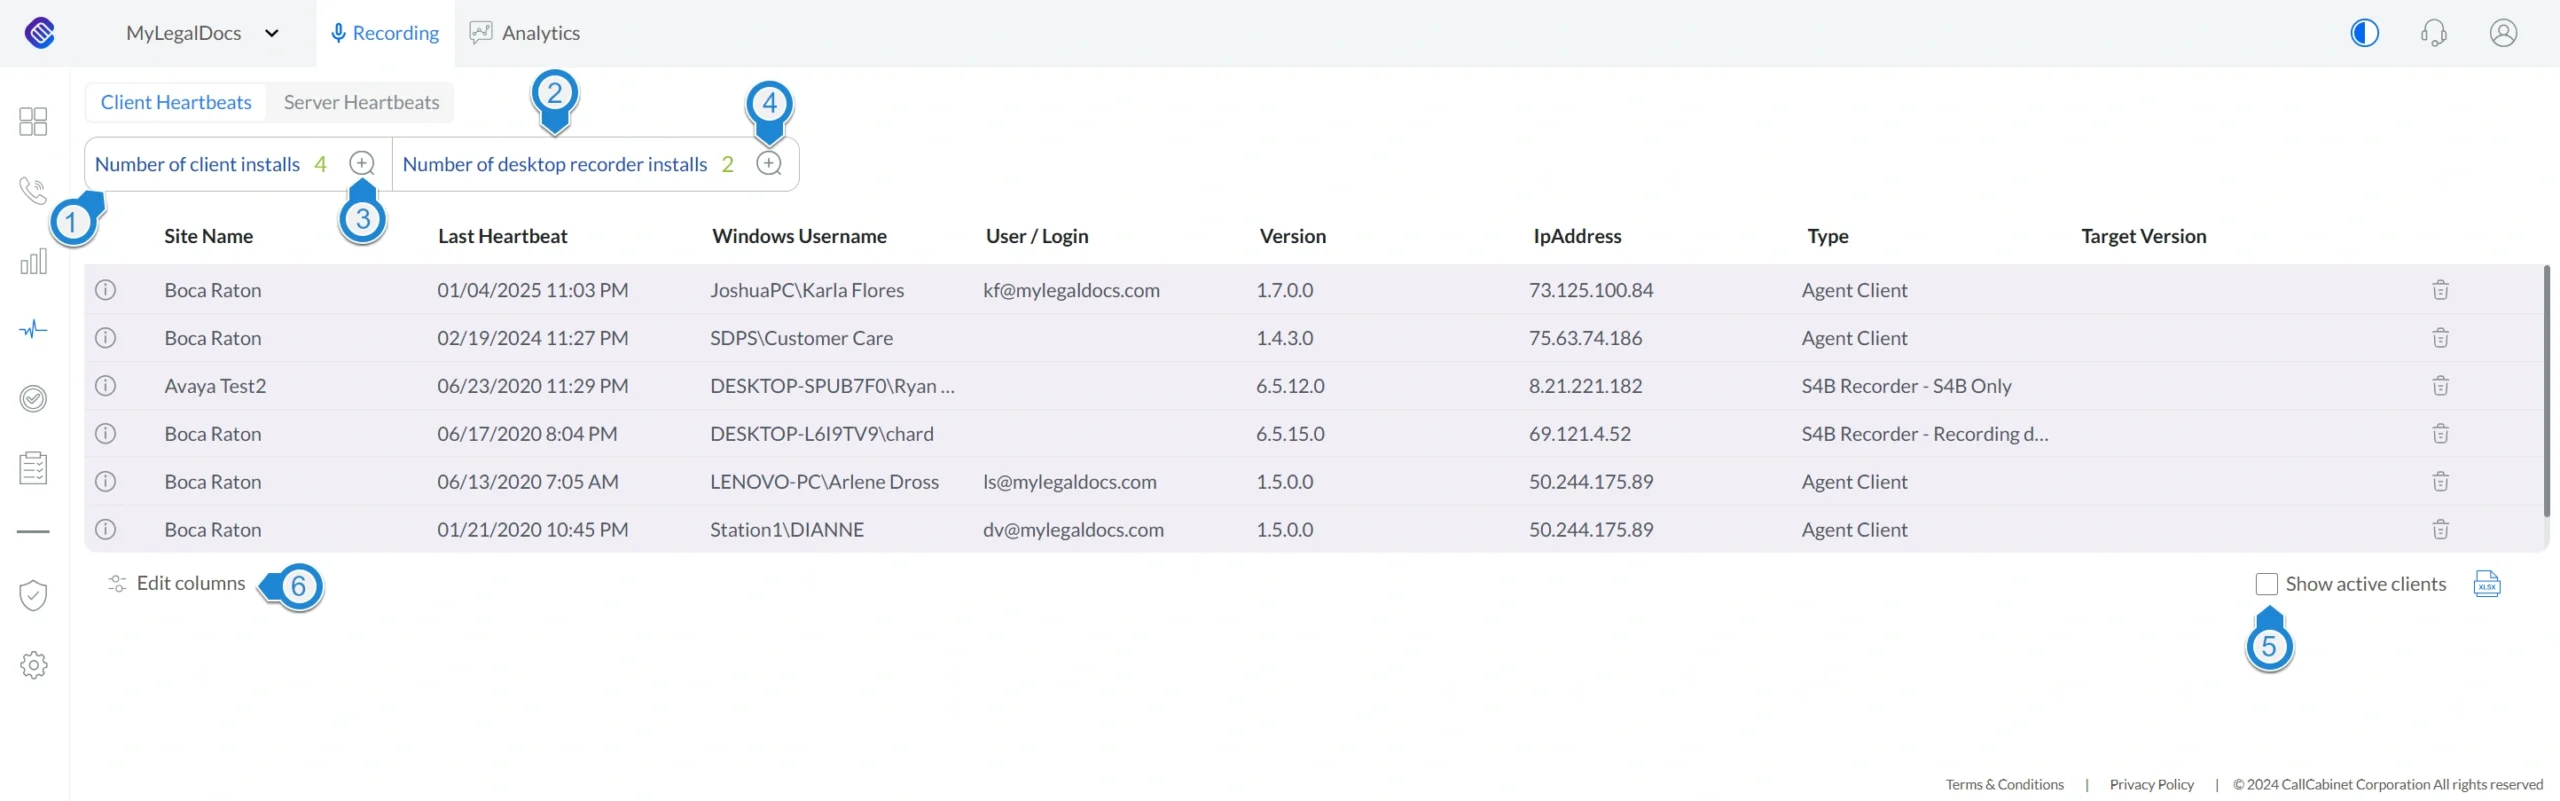
Figure – Client Heartbeats
The Client Heartbeats page allows the user to evaluate the number of CallCabinet Agent Client as well as Desktop Recorder installs, as illustrated in Figure – Client Heartbeats by the numbers 1 and 2 respectively.
The table renders all client and desktop recorder installs as well as which sites and IP addresses are actively using these features. If the site is online then the background color is white. Should the site be offline for more than 60 minutes then the background color is ‘purplish’, as illustrated in Figure – Client Heartbeats. By looking at the Last Heartbeat column the user can determine the last time communication occurred with the install. To display any clients currently active the user would check the checkbox Show active clients as illustrated by 5 in Figure – Client Heartbeats. As an example, a screen similar to Figure – Active Clients could be rendered when checking this checkbox.
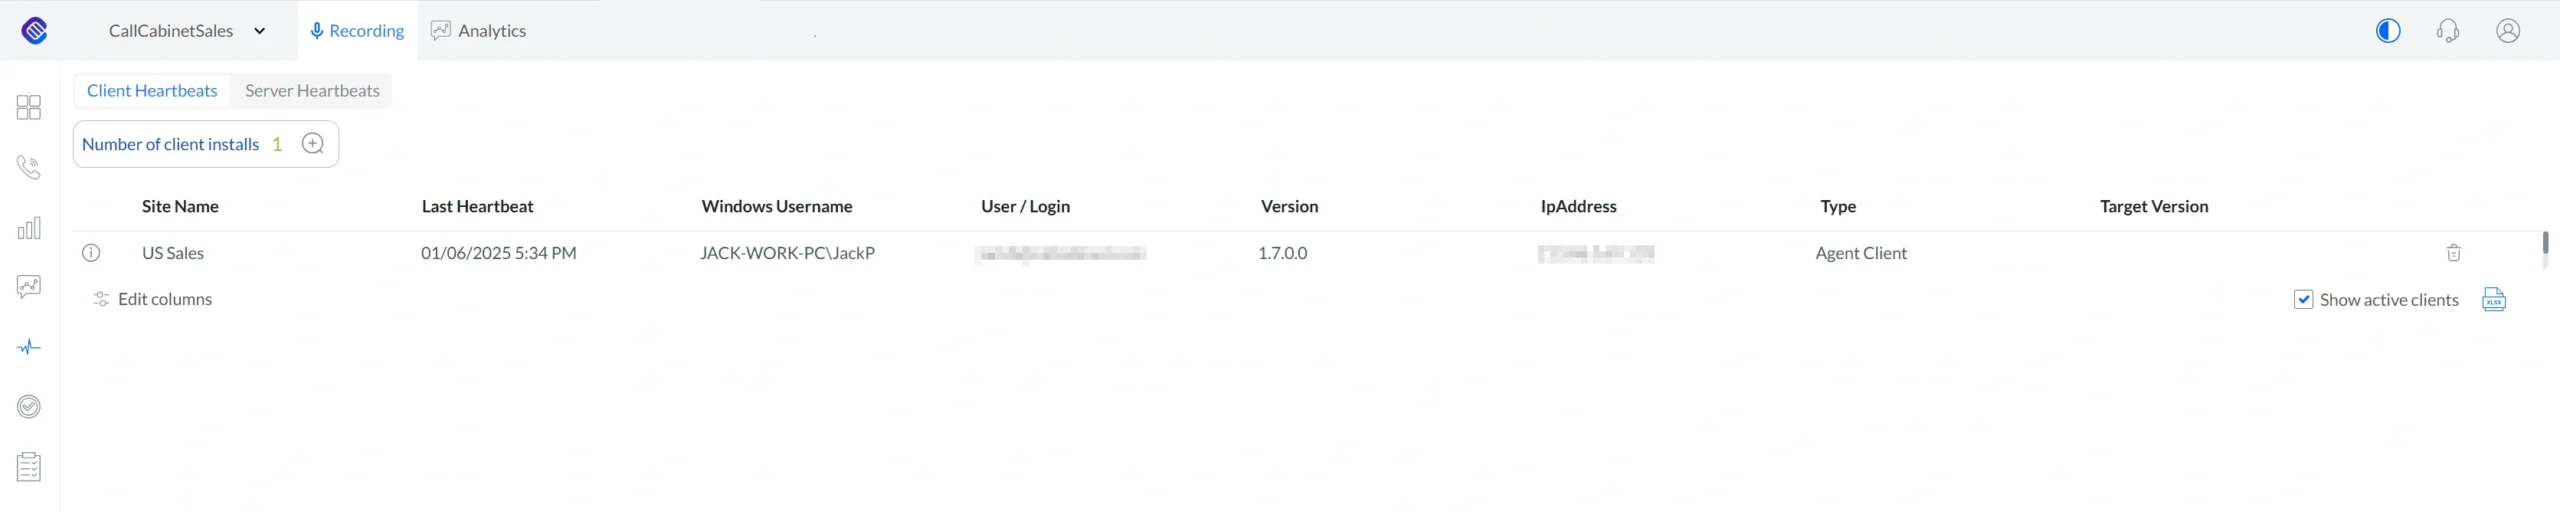
Figure – Active Clients
Each column in the data table can be sorted by clicking on the column name and filtering can be applied by clicking on the ‘filter icon’ ![]() adjacent to the column heading that the user’s cursor hovers over and the user is wanting to apply the filter. The user may remove or add columns to the table by clicking the Edit columns button illustrated by 6 in Figure – Client Heartbeats.
adjacent to the column heading that the user’s cursor hovers over and the user is wanting to apply the filter. The user may remove or add columns to the table by clicking the Edit columns button illustrated by 6 in Figure – Client Heartbeats.
NOTE: Clicking the Excel ![]() icon in Figure – Client Heartbeats will result in the exporting of all the current displayed page’s data to the user’s local machine.
icon in Figure – Client Heartbeats will result in the exporting of all the current displayed page’s data to the user’s local machine.
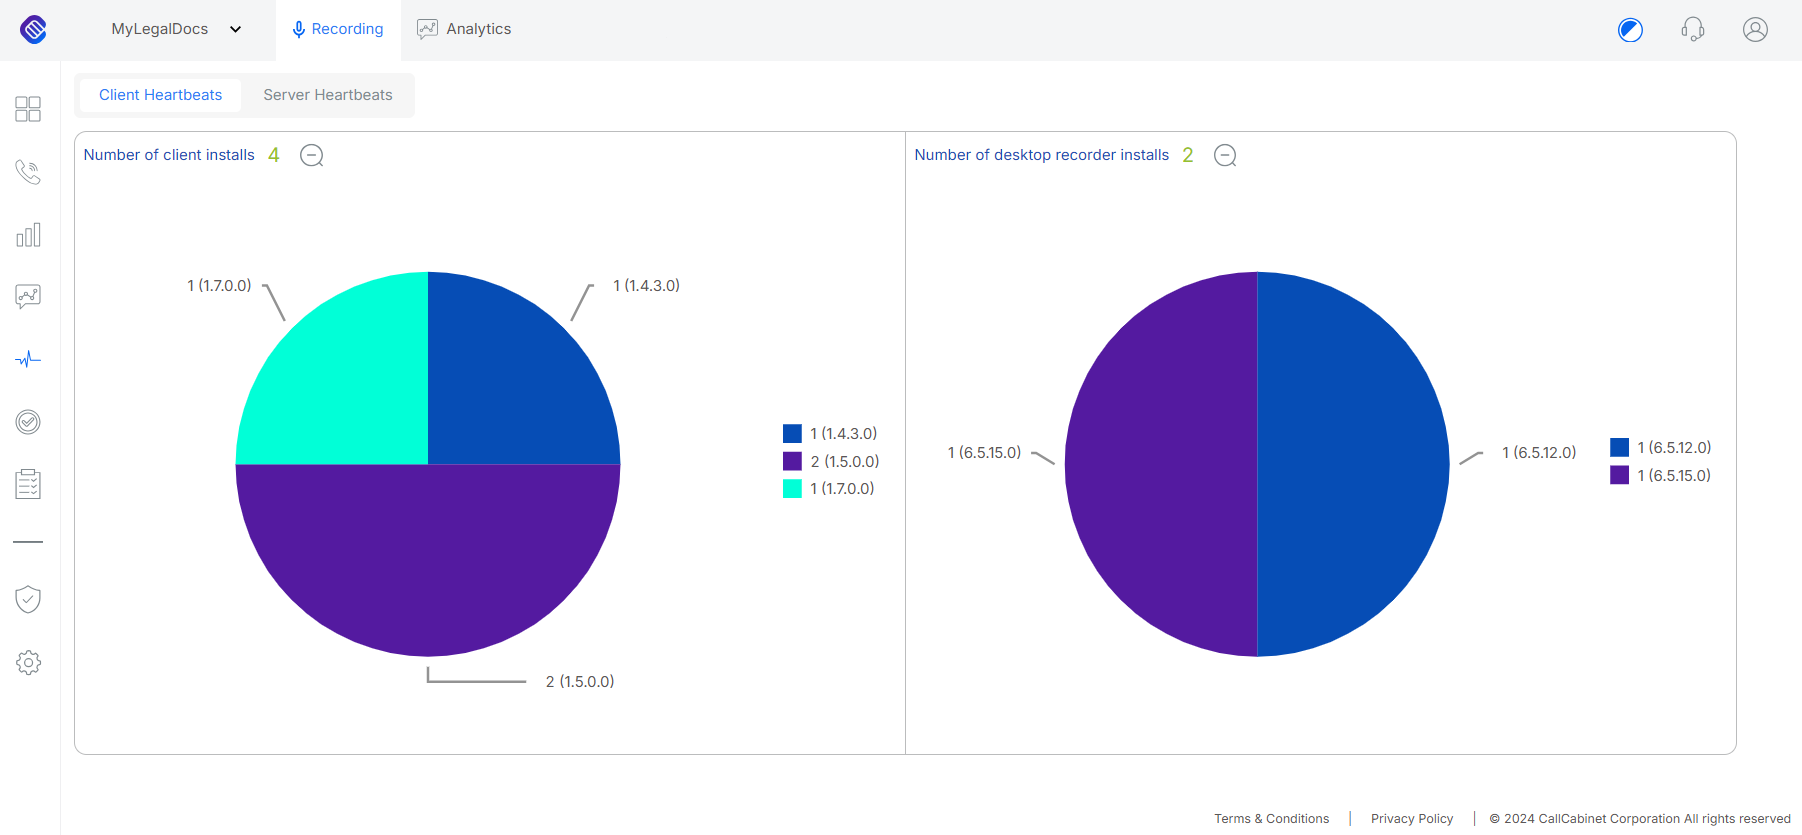
Figure – Desktop Versions
Should the user click the magnifier icon, illustrated by item 3 and 4, a pie chart graphic is rendered displaying which versions of the CallCabinet Desktop Client and Desktop Recorder, respectively your agents are running. An example of this is illustrated in Figure – Desktop Versions. Clicking on the magnifier returns the user to the view illustrated in Figure – Client Heartbeats.
Client Heartbeat is the signaling the Screen Recorder (Client) will send to the Customer’s account on CallCabinet. The Client Heartbeat will send a report, by default, every 5 min. The Client’s report includes the last contact with the ScreenRecorderClient/ScreenshotRecorderClient and the following information:
- Windows User Name
- Version of the Installed Software
- Type of Recorder.
- Public IP Address where the Client is installed.
Server Heartbeats
NOTE: An Advanced User License, Administrative user role, Quality Assurance Analyst License or Quality Assurance Admin License is needed to access the Client Heartbeats page.
Figure – Server Heartbeats
The Server Heartbeats section, example of which is illustrated in Figure – Server Heartbeats, is rendered when the user clicks on the Server Heartbeats button, which details the health of the connection between CallCabinet and the storage server(s) by monitoring, per site, the last contact with the server, and any possible errors. Each column in the grid can be sorted by clicking on the column name and filtering can be applied by clicking on the filter icon ![]() adjacent to the column heading which appears as the user moves their cursor over the column name the user is wanting to apply the filter. The user may also add or remove column names by clicking on the Edit columns button on the left of the table.
adjacent to the column heading which appears as the user moves their cursor over the column name the user is wanting to apply the filter. The user may also add or remove column names by clicking on the Edit columns button on the left of the table.
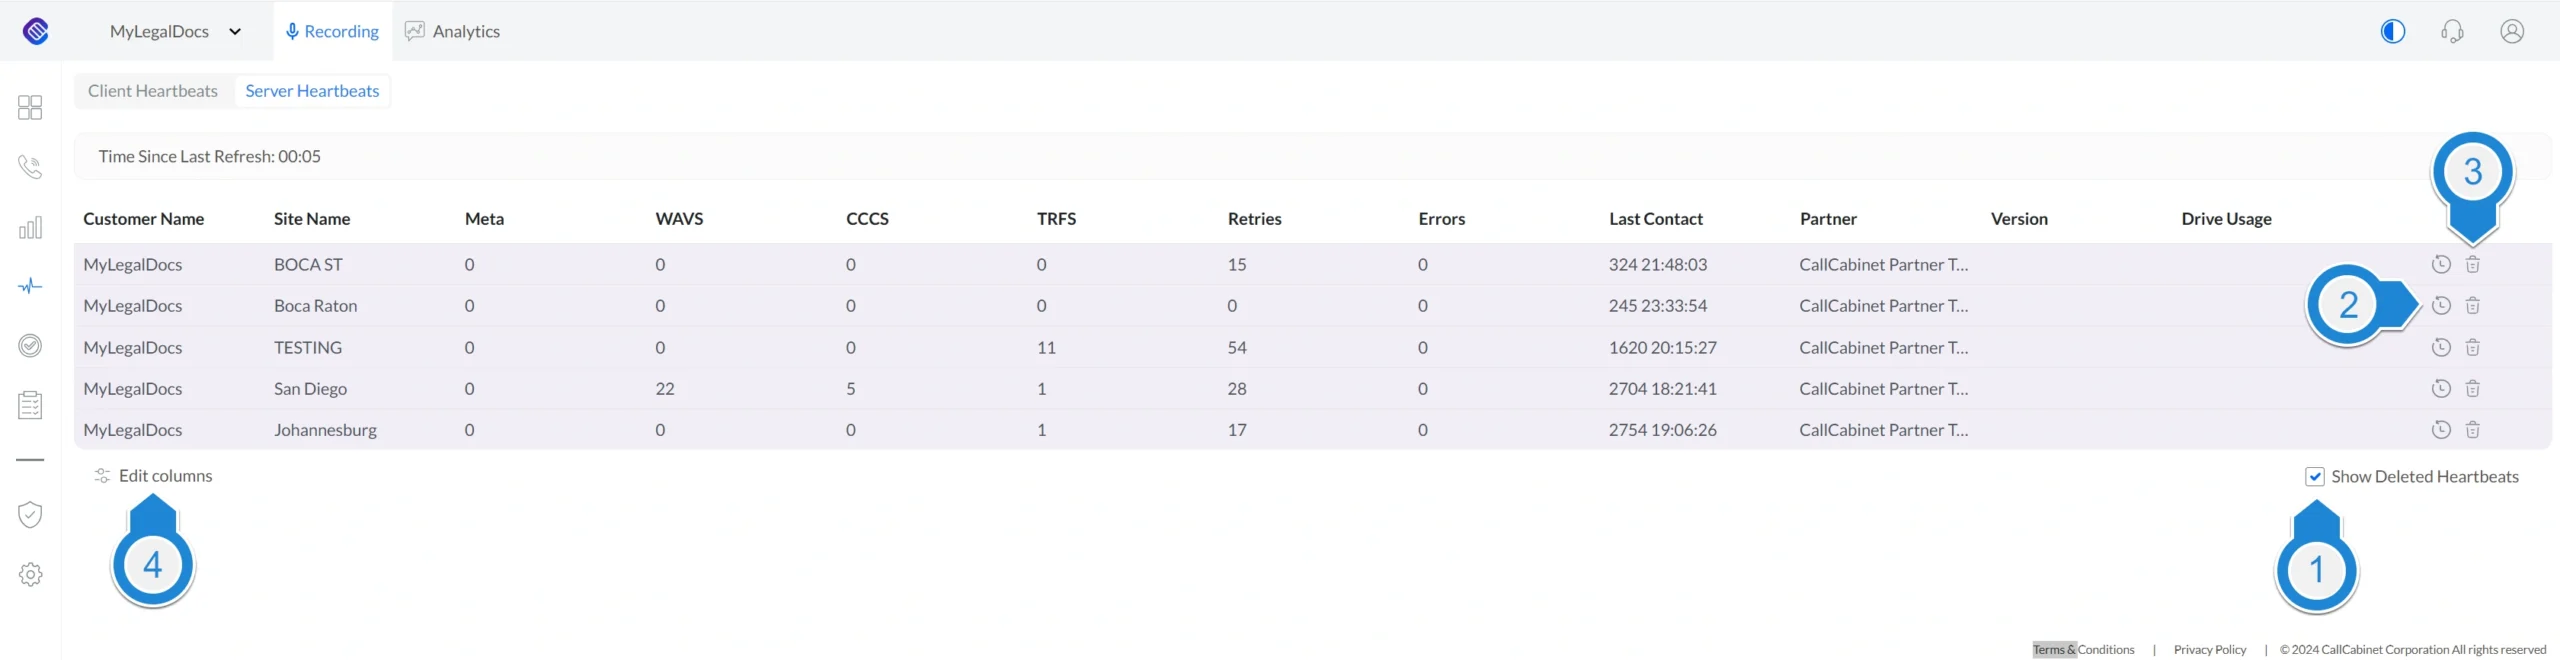
Figure – Detailed Heartbeats
By a user clicking on the Show Deleted Heartbeats check box on the top right-hand side, above the data table in the screen as shown in Figure – Server Heartbeats. Then a screen similar to Figure – Detailed Heartbeats is rendered. If the user wishes to request a detailed log, they would click on the log icon ![]() indicated by 2 in Figure – Detailed Heartbeats, which results in a dialog confirming whether this action should be fulfilled. This is illustrated in Figure – Heartbeat Log Request. Should the user want to delete
indicated by 2 in Figure – Detailed Heartbeats, which results in a dialog confirming whether this action should be fulfilled. This is illustrated in Figure – Heartbeat Log Request. Should the user want to delete ![]() an entry, they would click on 3. Finally, if the user would like to return to the Client Heartbeat page, they would click on the Client Heartbeats tab.
an entry, they would click on 3. Finally, if the user would like to return to the Client Heartbeat page, they would click on the Client Heartbeats tab.
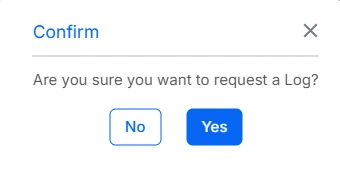
Figure- Heartbeat Log Request
The Server Heartbeat is the signaling the Recorder Server will send to the Customer’s account on CallCabinet. The Server’s Heartbeats will send a report, by default, every 5 min. The Server’s report includes the last contact with the Server as well as the following information;
- Total Audio Files.
- Total Upload Retries on a Failure.
- Total Pending to Process Recordings.
- Total Encrypted Audio Files.
- Total Uploaded recordings.
- Total Processing ERROR.
- Total Consumed Drive Space.
QA Dashboard
NOTE: A Quality Assurance Supervisor License, Quality Assurance Analyst License or Quality Assurance Admin License is required to access the QA Dashboard Page.
NOTE: The decimal resolution of the percentage mark attained by the Agent being evaluated may be set to between 0 and 4 inclusive by an Admin user in the Settings > General > Quality Assurance Settings tab.
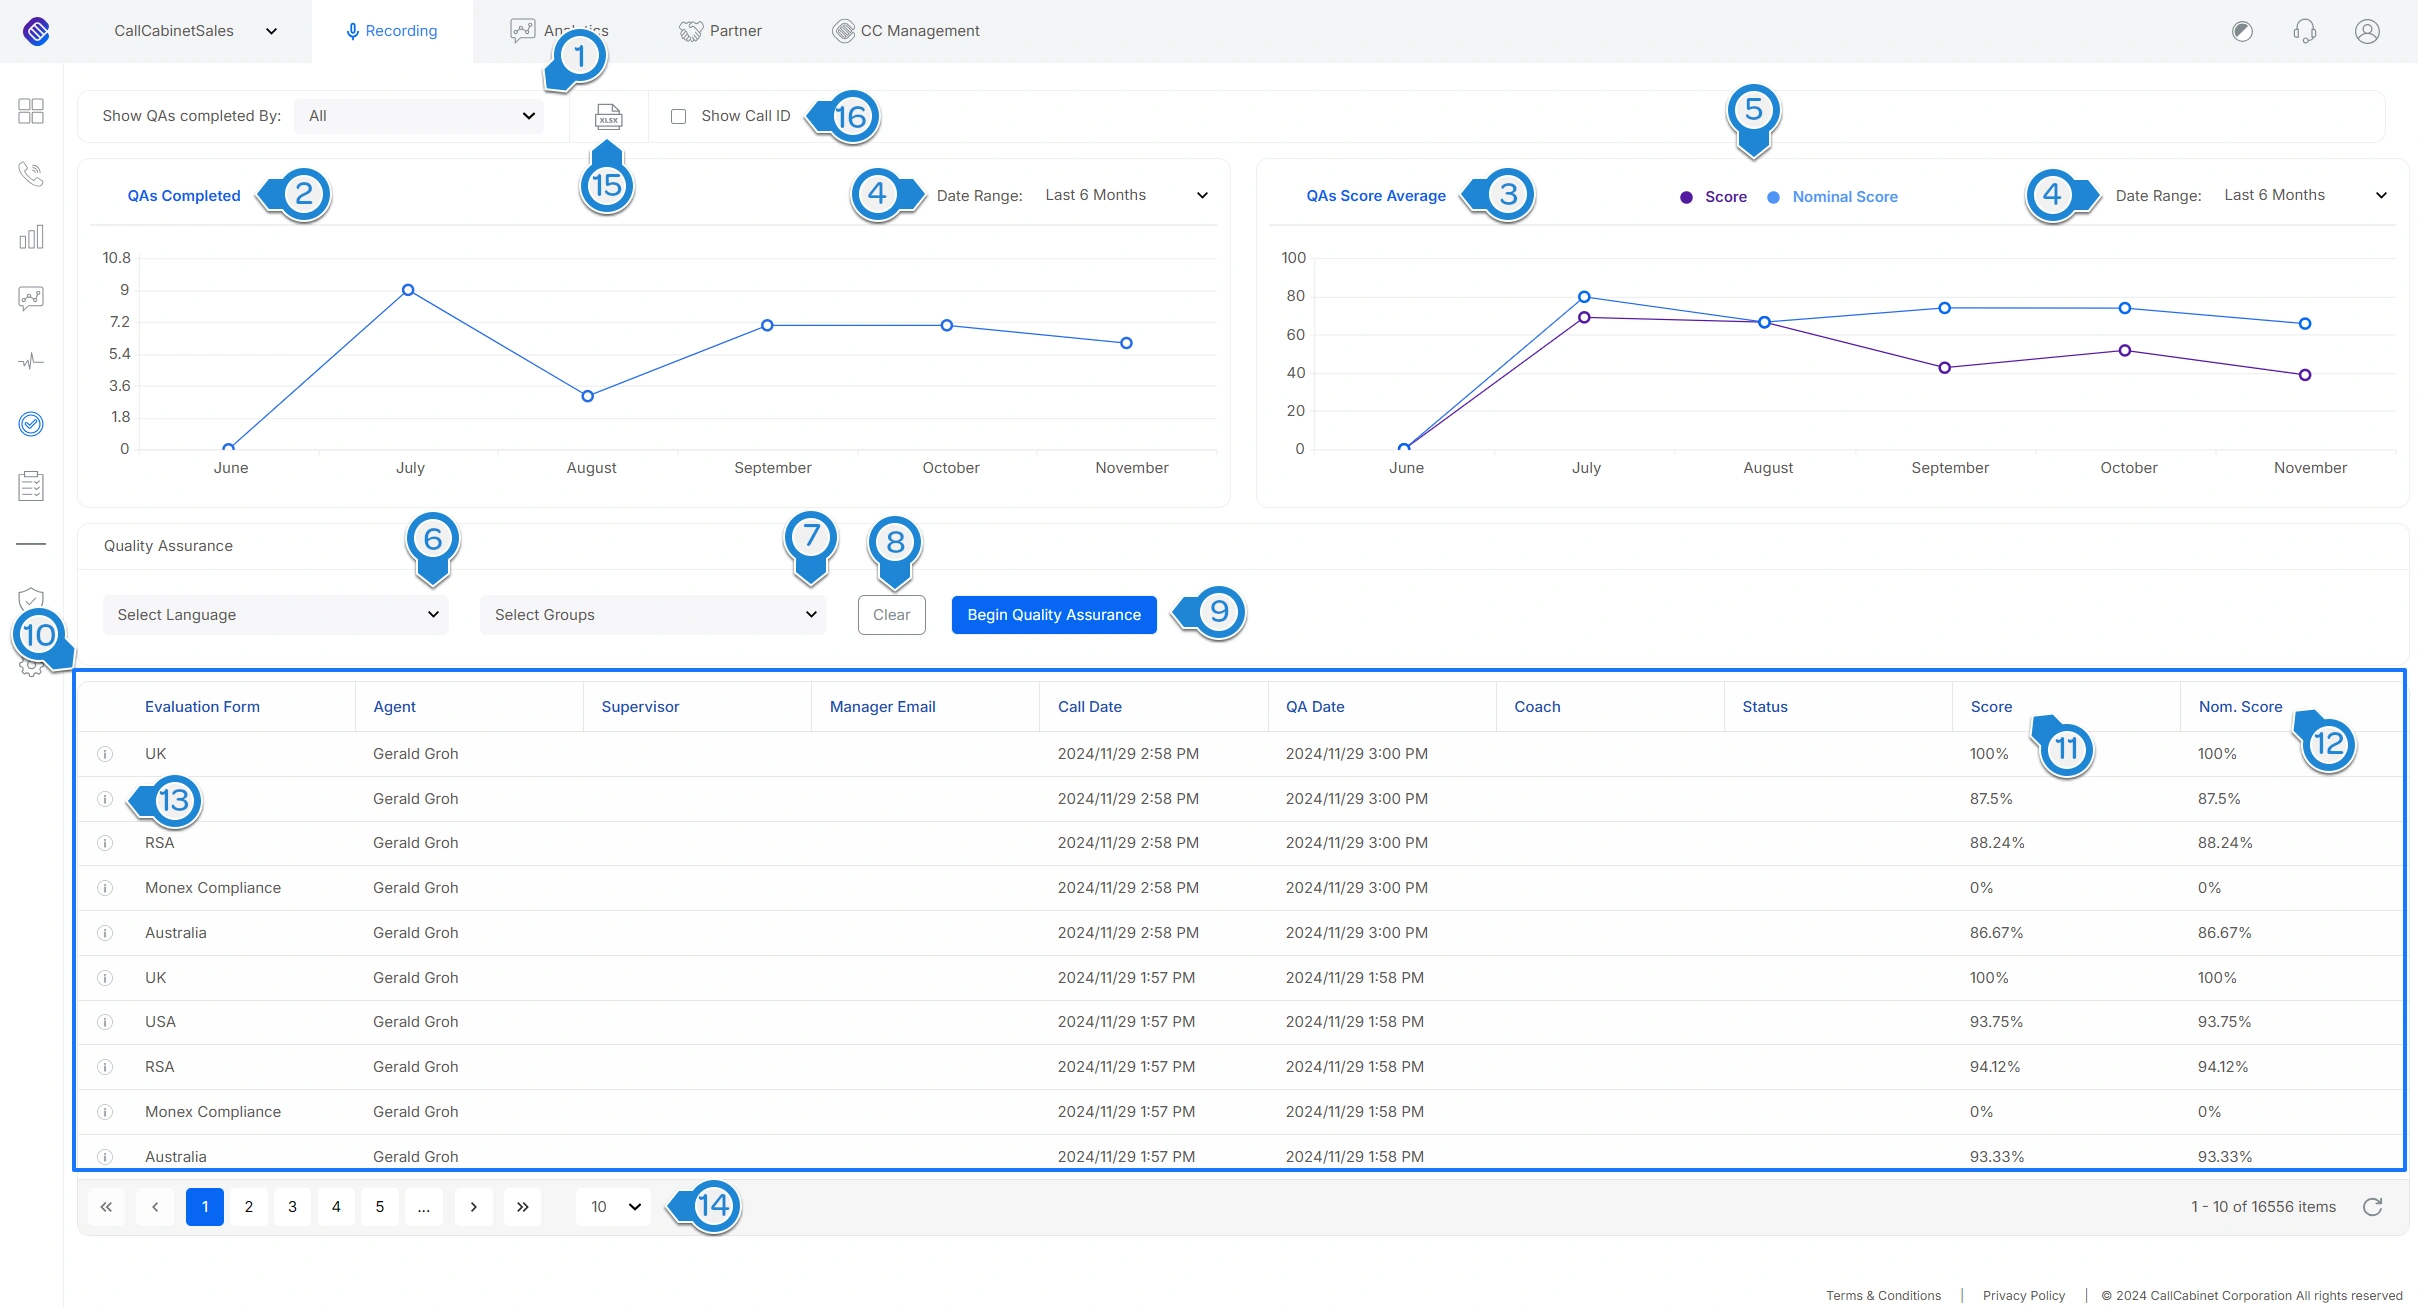
Figure – QA Dashboard
The Quality Assurance (QA) Dashboard permits a quality assurance licensed user an overview of the quality assurance scores and is the launch point for the CallCabinet QA Randomizer.
The numbers in the discussion below relate to the image in Figure QA Dashboard:
- The Show QAs completed by drop-down permits a user to determine, from the dropdown menu, which calls are displayed in the QA Data Table by selecting which QA Admin’s evaluations they would like to see.
- QAs Completed presents the logged in user with a graphical overview of the number of quality assurance sessions completed. The data displayed is dynamically updated, based on the number of QA sessions completed within the selected date range (see item 4 below).
- QAs Score Averages presents the logged in user with a graphical overview of completed quality assurance session scores. The data displayed is dynamically updated, based on the score averages within the selected date range (see item 4 below).
- The Date Range drop-down menu allows users to choose a date range for the dashboard QA graphs. The user can select between the last 6 months, 4 weeks or 14 days
- The key for the QAs Score Averages score and nominal score point to point graph color.
- Filters allow a user to filter the calls they will be scoring using the QA randomizer. Any languages or agent groups the user created (see Settings > Agent Groups) will appear in the dropdown menus. Selecting a filter from the menus narrows the focus of the QA randomizer.
- As per point 6.
- Clicking Clear will clear all the filters the user has set and return them to the default settings.
- Clicking on the Begin Quality Assurance button will launch the QA randomizer. This will result in a call being randomly selected to score. Should none of the parameters under Settings > QA Randomizer be applied, then the randomly selected call will fall within the attributes of the parameter(s). NOTE: The user will be required to set basic parameters such as; the percentage of incoming and outgoing calls to include in the QA Randomizer before it can be invoked.
- The QA Data Table displays key information about completed quality assurance sessions. The user can sort any of these columns by clicking on the column’s name. The user can filter by clicking the icon that appears as the user passes their cursor over the name of each column of the Evaluation Form
- Score is the QA score of the call itself
- Nom Score is the QA score the agent would have achieved was it not for section fails or total fails in the Evaluation Form.
- Should the user want to all about a particular call, they may click on the information icon , which will navigate the user to the call details page associated with the selected call.
- The Items Per Page drop-down allows a user to change the number of items returned on each page. The range is from 10 – 2000
- Clicking the Excel icon will result in the exporting of all the currently displayed page’s data in an Excel document which will be downloaded to the user’s local machine.
- Ticking the Show Call ID check box will activate a hidden column in the QA data table (item 10) displaying each call’s Unique Call ID.
QA Scorecards
NOTE: A Quality Assurance Admin License is needed to access the QA Scorecards Page.
NOTE: The decimal resolution of the percentage mark attained by the Agent being evaluated may be set to between 0 and 4 inclusive by an Admin user in the Settings > General > Quality Assurance Settings tab.
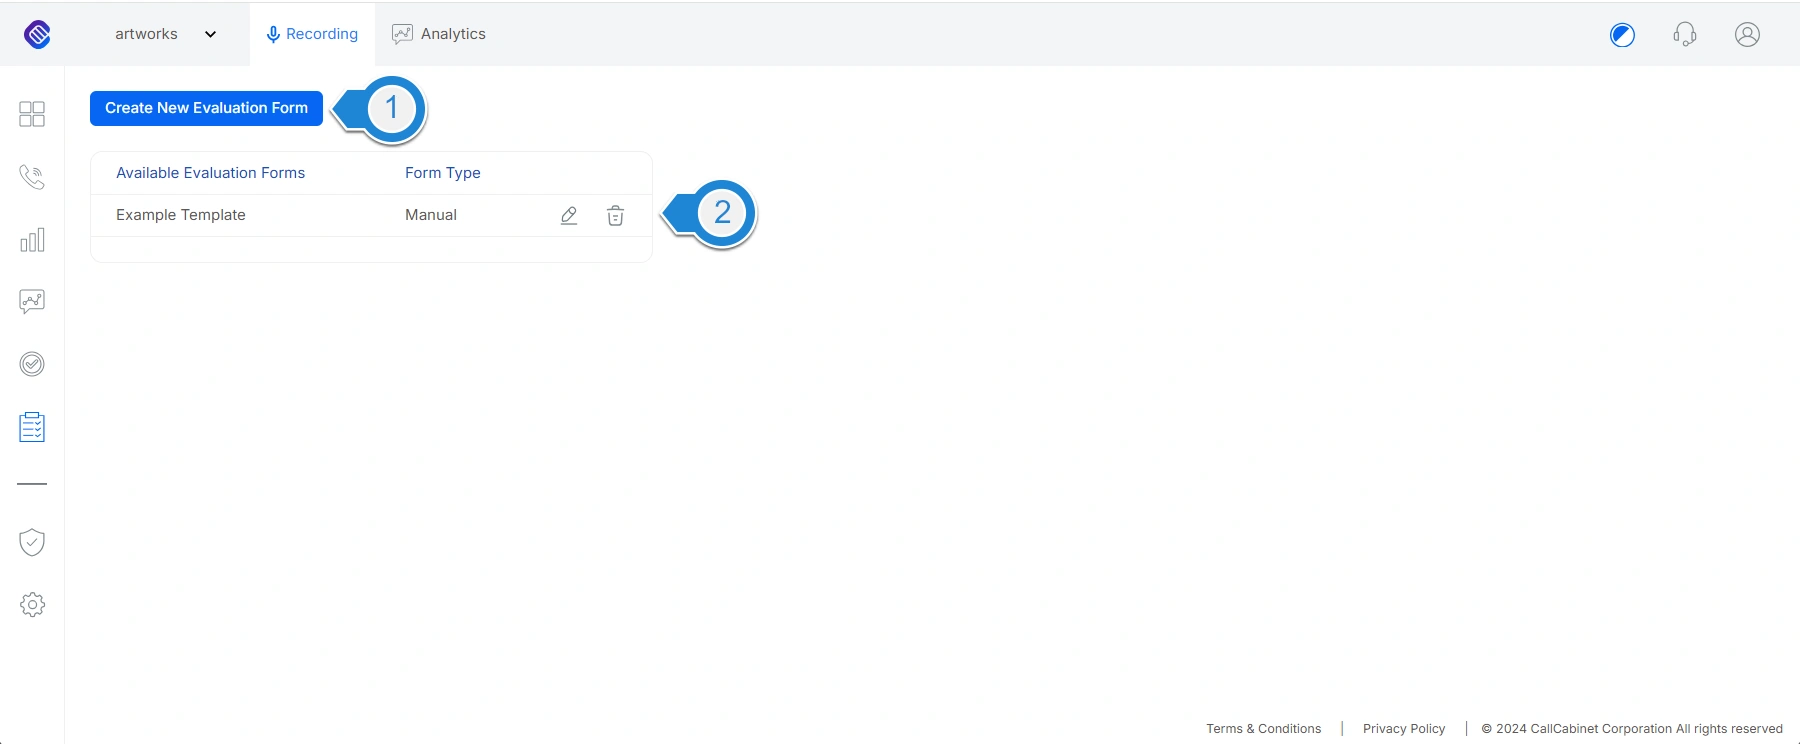
Figure – QA Scorecard
The QA Scorecards Page permits a user with a quality assurance license to create, edit and delete quality assurance evaluation forms. There are two types of scorecards. One for a manual QA process and the other for automatic QA processing. Some customers do not want to pay for analytics and automatic QA. They are happy with sampling a few calls to assess whether their agents are performing to the standards required by the company. For this initial discussion we will focus on the manual scorecard.
Creating a manual scorecard (evaluation form)
In order to perform QA, an evaluation form, also known as a scorecard, must have been created containing a series of questions that a supervisor will use when reviewing an agent’s call with a customer, thereby determining whether the agent did a good job, needs further guidance or training.
As a hint, when creating an evaluation form it is advisable that the user has a clear understanding of the questions that are to be asked, the section they belong to as well as the flow of the questions, depending upon the answer. There are no default forms. The customer themselves must create their own evaluation forms, creating questions appropriate for their business. Once a form is created it is stored and may be used to evaluate as many agents as required. A form may be edited, should the need arise.
- Clicking on the Creating a New Evaluation Form button illustrated by 1 in Figure – QA Scorecard will open up a blank canvas on which the logged in user, with the requisite authority may create a new evaluation form by. An example of the screen is rendered when clicking on 1 in Figure – QA Scorecard is illustrated in Figure – Creating a New Evaluation Form.The discussion following relates to the image, Figure – Creating a New Evaluation Form. A question may be added to the form by clicking on the Add Question button indicated by 1, which will result in a question dialog appearing, indicated by 2. Each time the Add Question button is clicked a new question dialog will appear on the form. To remove a question dialog, the user will click on Remove Question, indicated by 11, then clicks on the question, removing it. To reverse any editing decision, a user may click on the Undo button, indicated by 12.The user may now enter a question in the question dialog, indicated by 3. A hint for the question, providing more information about the question for the supervisor who will be conducting the evaluation may be included by the user in the question dialog. This hint is entered in the block illustrated by 4. Questions are allocated to sections. A section type can be selected from a dropdown as illustrated by 5. If the user requires a section type that is not in the dropdown, then all the user needs to do is enter this new section type in the section field. Finally, the answer and the score associated with the answer is to be provided. To add the different answers that would be acceptable for the question, the user would press the + icon as illustrated by 6. Each click will add a new answer response as illustrated by 7. To remove an answer the user may click on the trash bin icon associated with that answer. If the answer is correct, then a maximum mark should be provided, in the example 100 is allocated. If the agent did not perform what the question asks, they then fail with a minimum mark, and given the mark 0 in the example. If the agent performed fairly, then an average mark may be allocated, which was given a value of 50 in the example. All the marks achieved by the agent by the end of the evaluation is the sum of their performance of each question.
In order for a supervisor to know which question to proceed to next, each question dialog is linked to another question dialog, as indicated by 8, via joining together the ‘bubbles’
 , indicated by 9, of each question. There is no limit to the number of questions and link paths. As more question dialogs and links are added, an elevated view known as a Navigation displays the complete evaluation form being created. This is illustrated by 10.
The user is able to preview the evaluation form to ensure that the flow and questions are correct. To do this, the user may click on the Preview button, as indicated by 13. This will render a new view whose look and feel is similar to that illustrated in Figure – Evaluation Form Preview.
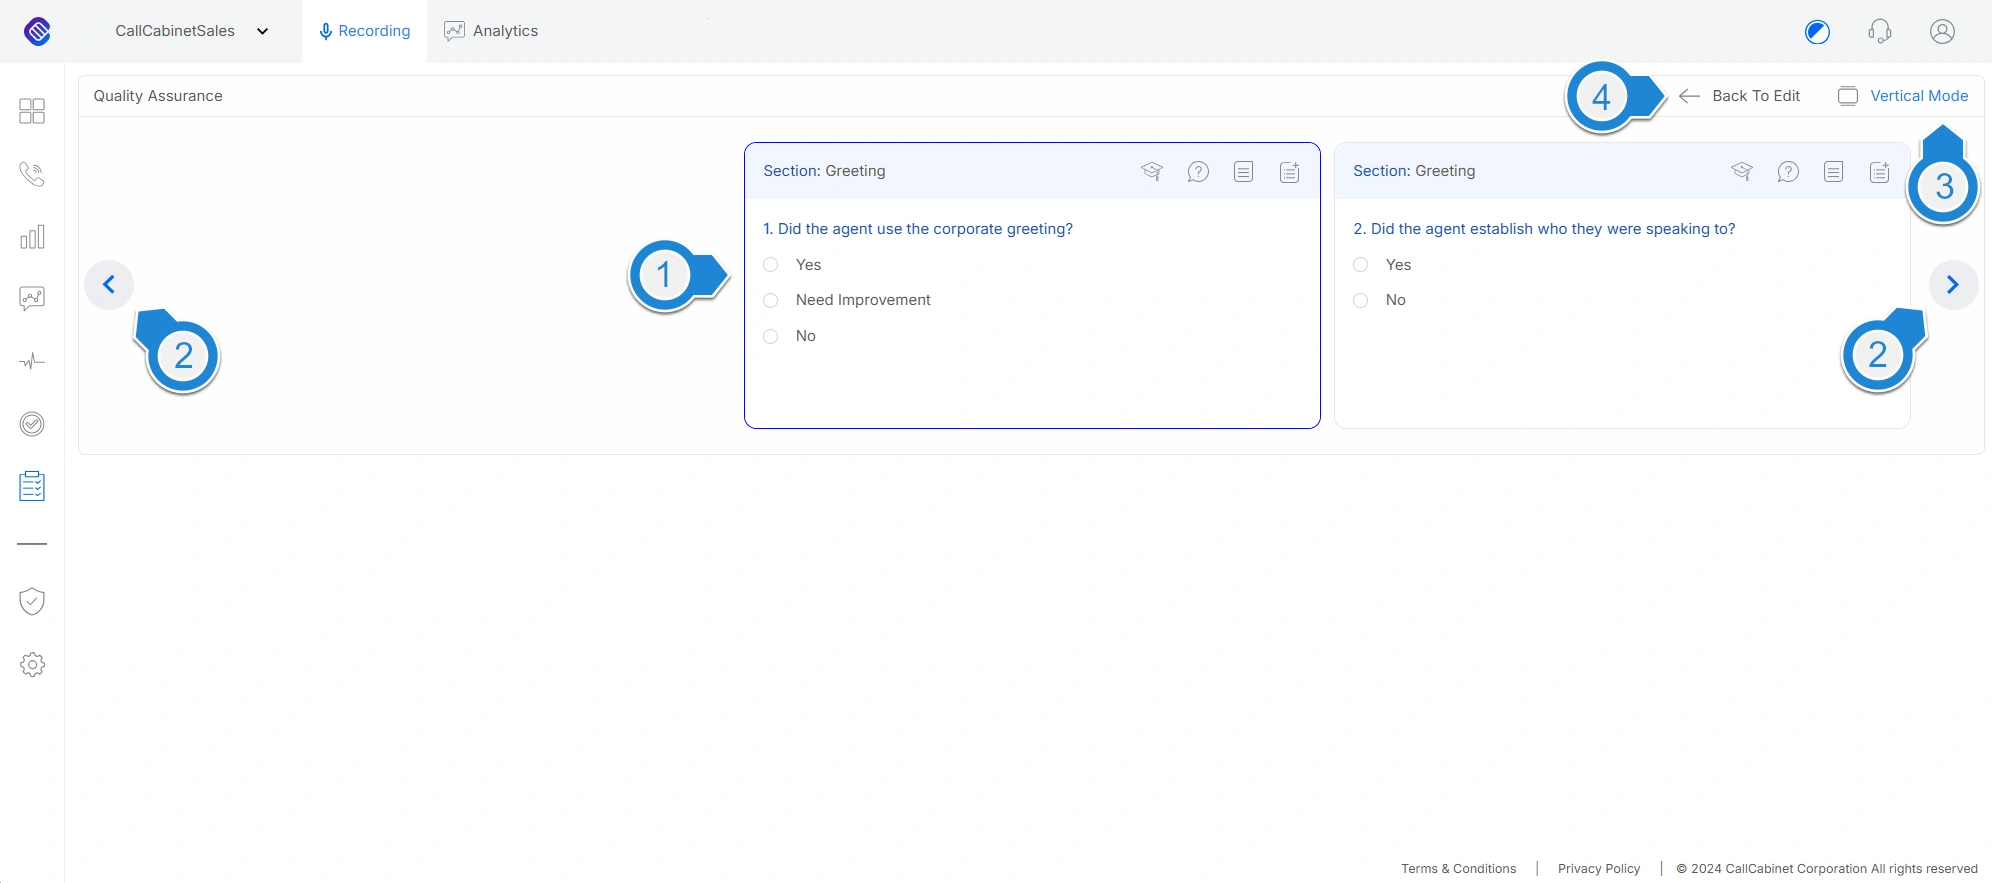
Figure – Evaluation Form Preview
The user is able to view each question, indicated by 1 in Figure – Evaluation Form Preview, its position and the question preceding or following, if applicable. The user may go backward or forward by clicking the appropriate arrow, as indicated by 2 in Figure – Evaluation Form Preview. The user may view the evaluation form in the horizontal mode, which is the default and that is illustrated in Figure – Evaluation Form Preview, or in vertical mode by clicking the Vertical Mode button as illustrated by 3 in Figure – Evaluation Form Preview. Once the user has completed viewing the evaluation form, they may return to the evaluation form edit view by clicking the Back to Edit button as illustrated by 4 in Figure – Evaluation Form Preview. If necessary, the user may edit the form.
Once the user has completed the evaluation form, it must be saved before it can be used in an evaluation. This is done by clicking on the Save and Exit button indicated by 14. NOTE: Should one or more question entities not be linked or the question not complete, the form will not be saved until the evaluation form is completed. To make a copy of the evaluation form, the user may click on the Save As button as illustrated by 15, and save the evaluation form under a new name. To exit without saving the user may click on the Exit
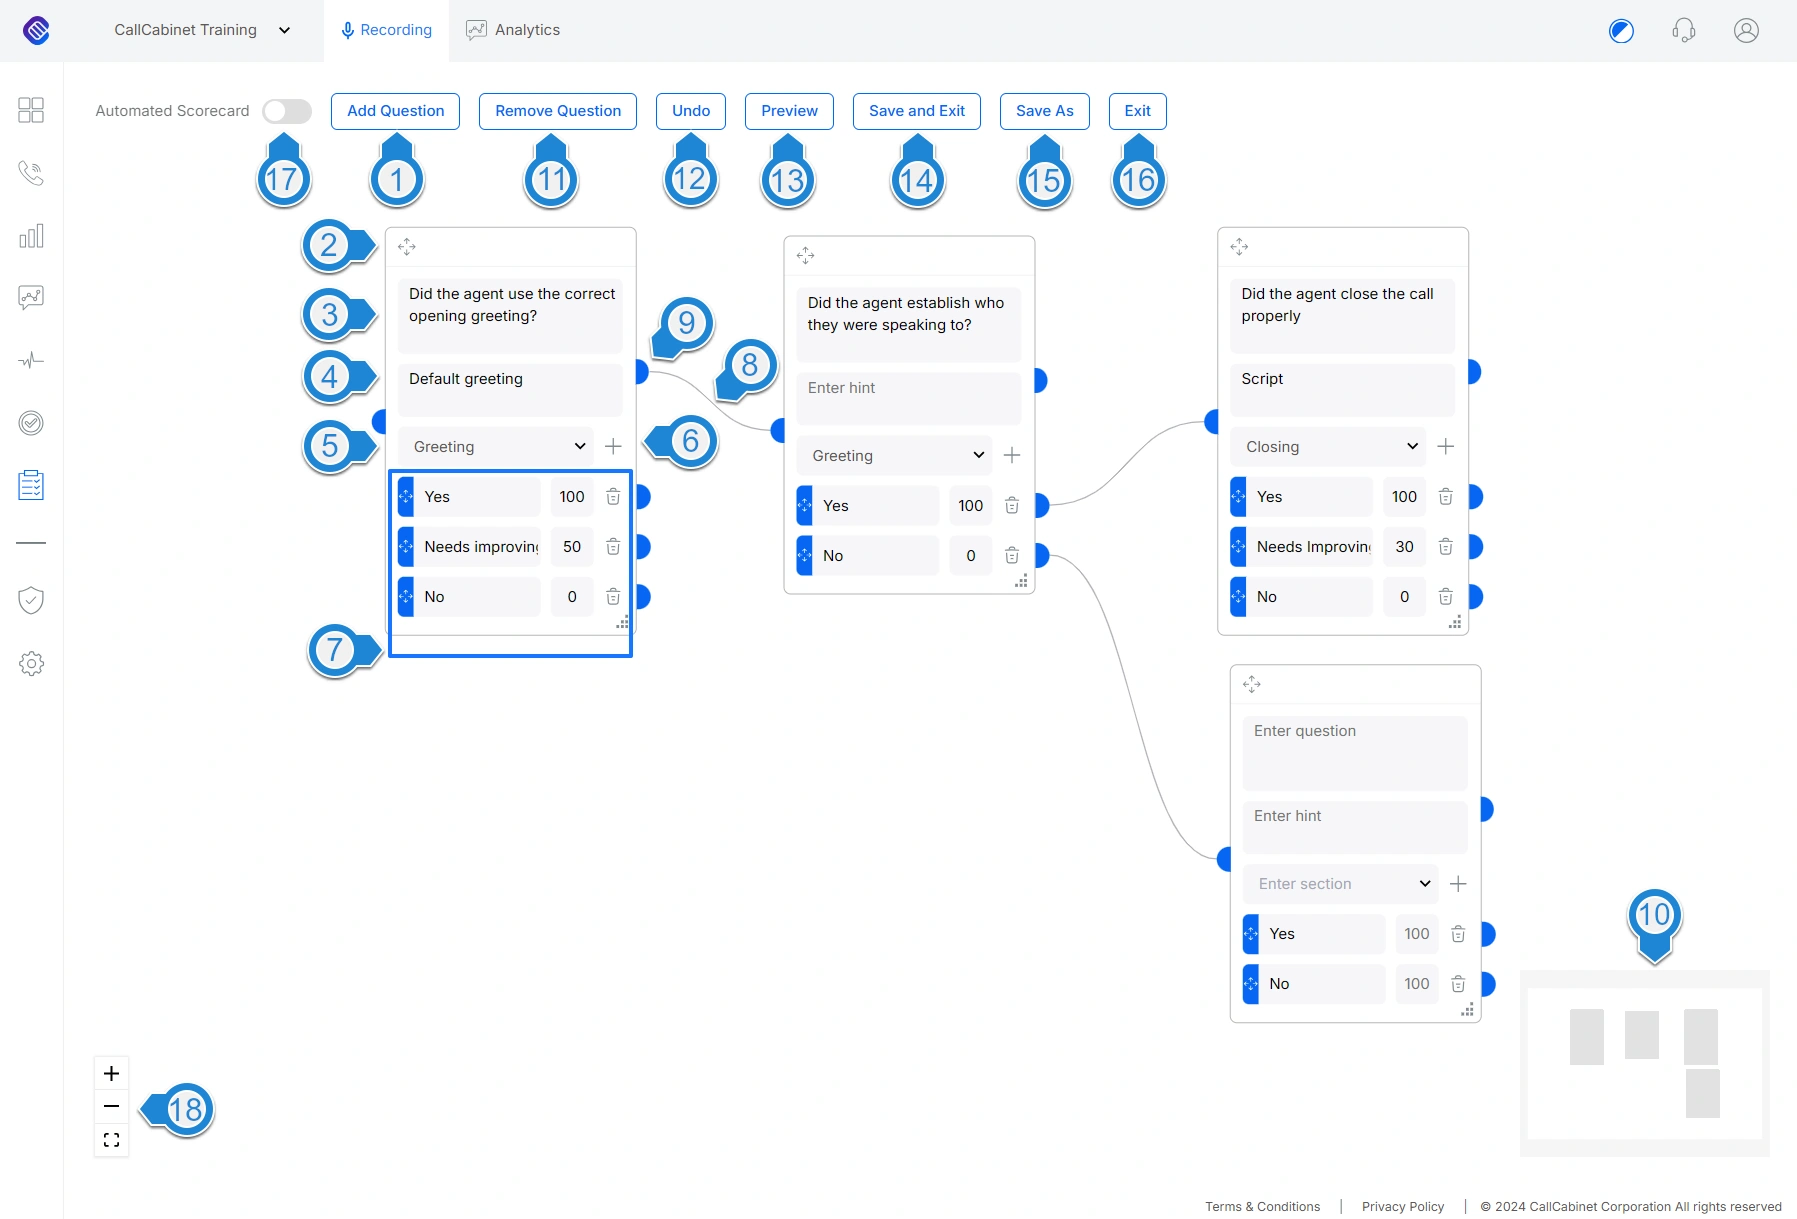
Figure – Creating a New Evaluation Form
button as illustrated by 16. The user is warned whether they would like to save any changes before finally exiting, in case the user clicked the button in error. When saving (or save-as) the evaluation form, a dialog pops up. This is illustrated in Figure – Save Form Dialog.
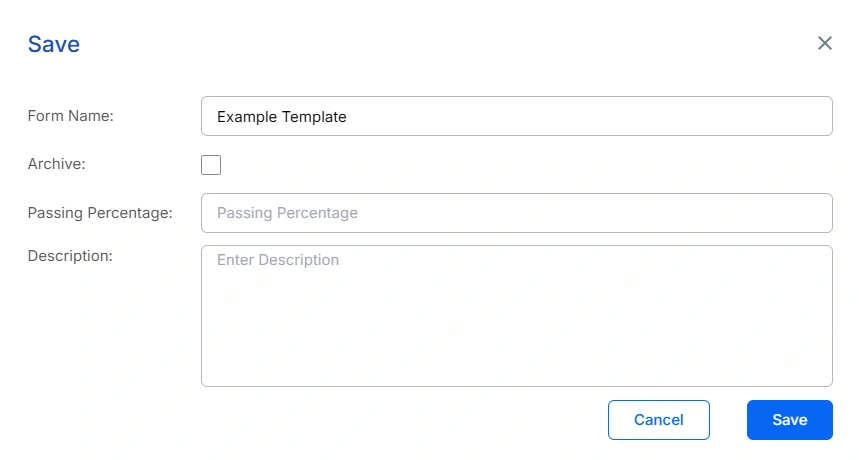
Figure – Save Form Dialog
The user enters the name of the form, the passing percentage and any description to explain the function of the evaluation form. If the user decides to check the Archive checkbox, then the evaluation form will be archived, and as a result will not appear as an evaluation form option when performing a manual QA. This can be reversed by unchecking the Archive checkbox.
- The Available Forms section illustrated by 2 in Figure QA Scorecard displays the saved evaluation
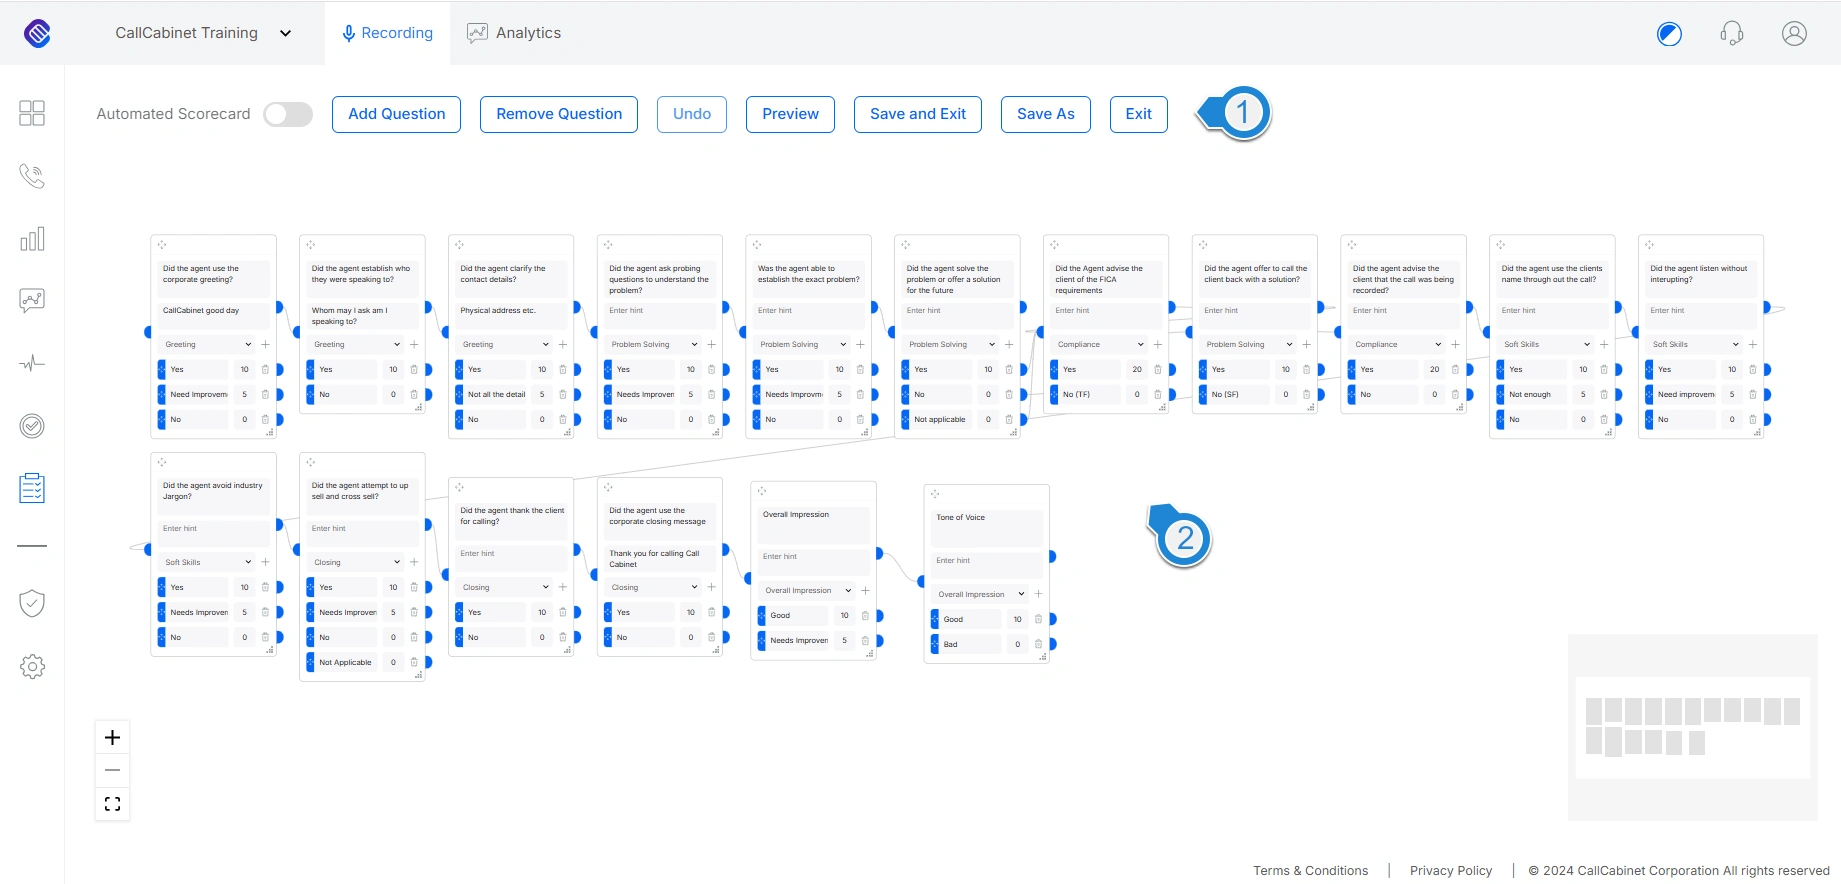
Figure – Editing an Evaluation Form
forms. By clicking on the name of a form, a form editor page is rendered. In this screen the user can edit and update the form accordingly. An example of the screen that will be rendered when clicking on a form’s name is illustrated in Figure – Editing an Evaluation Form. Clicking on the trash ![]() icon will delete the evaluation form.
icon will delete the evaluation form.
The numbers below relate to the image in Figure – Editing an Evaluation Form:
- Clicking on these buttons will allow a user to Add Question, Remove Question, Undo, Save and Exit, Save As, or Exit the screen. See the discussion under Create New Evaluation Form for more information.
- This area allows the user, with the requisite authority to create, edit and delete questions for the QA evaluation form a supervisor may use. Clicking the icon results in the deletion of an answer. Answer types include Point Value, N/A, Section Failure and Total Failure. The user designs the ‘question path’ by linking one question to another. It could be useful to add hints for each question in case the supervisor performing the QA is unsure of the question and its purpose. The Navigation window allows the user to get an overview of the form being created or edited.
Creating an automated scorecard (evaluation form)
Clicking on the Create New Evaluation Form button illustrated by 1 in Figure – QA Scorecard will open up a blank canvas on which the logged in user, with the requisite authority may create a new evaluation form by. An example of the screen is rendered when clicking on 1 in Figure – QA Scorecard is illustrated in Figure – Creating a New Automated Evaluation Form. To create an automated scorecard the user would toggle the Automated scorecard button, as illustrated by 1 in Figure – Creating a New Automated Evaluation Form.
Building an automated scorecard is very similar to creating a manual QA scorecard, however there are a number of extra options that may be configured. As a result of this, the user does not edit the question entity directly as was done when creating a manual scorecard, but through a configuration dialog that appears on the right side of the view.
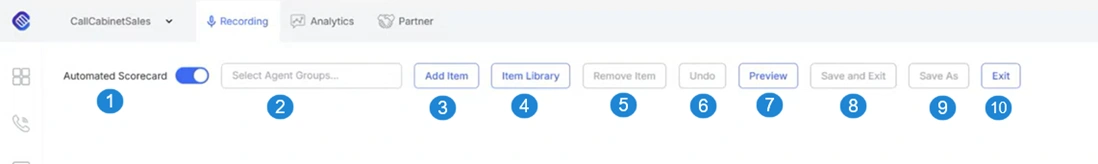
Figure – Creating a New Automated Evaluation Form
The following discussion related to the numbers in Figure – Creating a New Automated Evaluation Form.
- Toggling this to on will activate the canvas to create an automated scorecard that will be invoked after a call is completed.
- Select the group or groups whose agent members will have this scorecard automatically applied to once their call is completed.
- Clicking Add Item allows the logged in user to add a QA Question, Topic or Filter to the scorecard. You can also click Add to Library to add the item to the library.
- Clicking Item Library allows users to add a curated list of suggested and previously added items, enabling quick selection and inclusion in scorecards without having to start from scratch. This option is available while creating an item.
- Clicking Remove Item will allow the logged in user to remove a QA Question, Topic or Filter from the scorecard being created or edited.
- Clicking Undo will restore the previous action.
- Once the user has completed the scorecard, they are able to Preview it to ensure it is correct. For example;

- Clicking Save and Exit will result in the scorecard being saved and the user leaving the scorecard editor and returning to the scorecard list view.
- Clicking Save As will allow the user to save the current scorecard under a different name. This is a way the logged in user may copy a scorecard before making changes to it.
NOTE: When using Save As to create a new scorecard, the Agent Group is not copied and must be selected manually. - Clicking Exit results in the user leaving the scorecard editor and returning to the scorecard list view.
When a logged in user clicks on Add Item as illustrated by 3 in Figure – Creating a New Automated Evaluation Form, they may select one of three items (or entity) types they would like to use. These are Filter, QA Question and Topic, which are selectable from a dropdown list. The QA Question entity and its behavior is the same as in the manual scorecard. For instance, the question could be ‘Did the agent use the proper corporate greeting?’ If yes, the agent is awarded points, if no, then no points are awarded. Filter entities do not contribute to an agent’s score but rather allows for a dynamic scorecard in terms of flow. Depending upon a filter’s criteria, if those criteria are matched the scorecard question flow may change from that if the criteria are not matched. This allows for a far more interactive and dynamic scorecard.
A Filter entity may be configured as one of the following types;
- Audio Duration Seconds
- Agent
- Agent Group
- Site Name
- Silence %
- Overtalk %
- Phrases
- Sentiment %
The user would select the filter type they would like and enter the criteria associated with that filter type.
A Topic is a structural element that a user may add to a scorecard which is used by CallCabinet’s Analytics engine to assess the most frequently mentioned topics in a conversation and relate to a customer’s experience. For example, is this call classified as website support? If it is, proceed with a certain flow of questions. If not, then take a different question flow path.
Let us look at this a little more with an example. When the user clicks the Add Item button, a configuration dialog appears. This is illustrated below;
Assuming the user wishes to create a Filter item whose criteria demand that if the call is longer than one minute, the scorecard should be applied in evaluating the call’s agent. If it is shorter than a minute, the scorecard evaluation should be ignored. To accomplish this, the user clicks the Filter item resulting in a new dialog appearing as illustrated below;
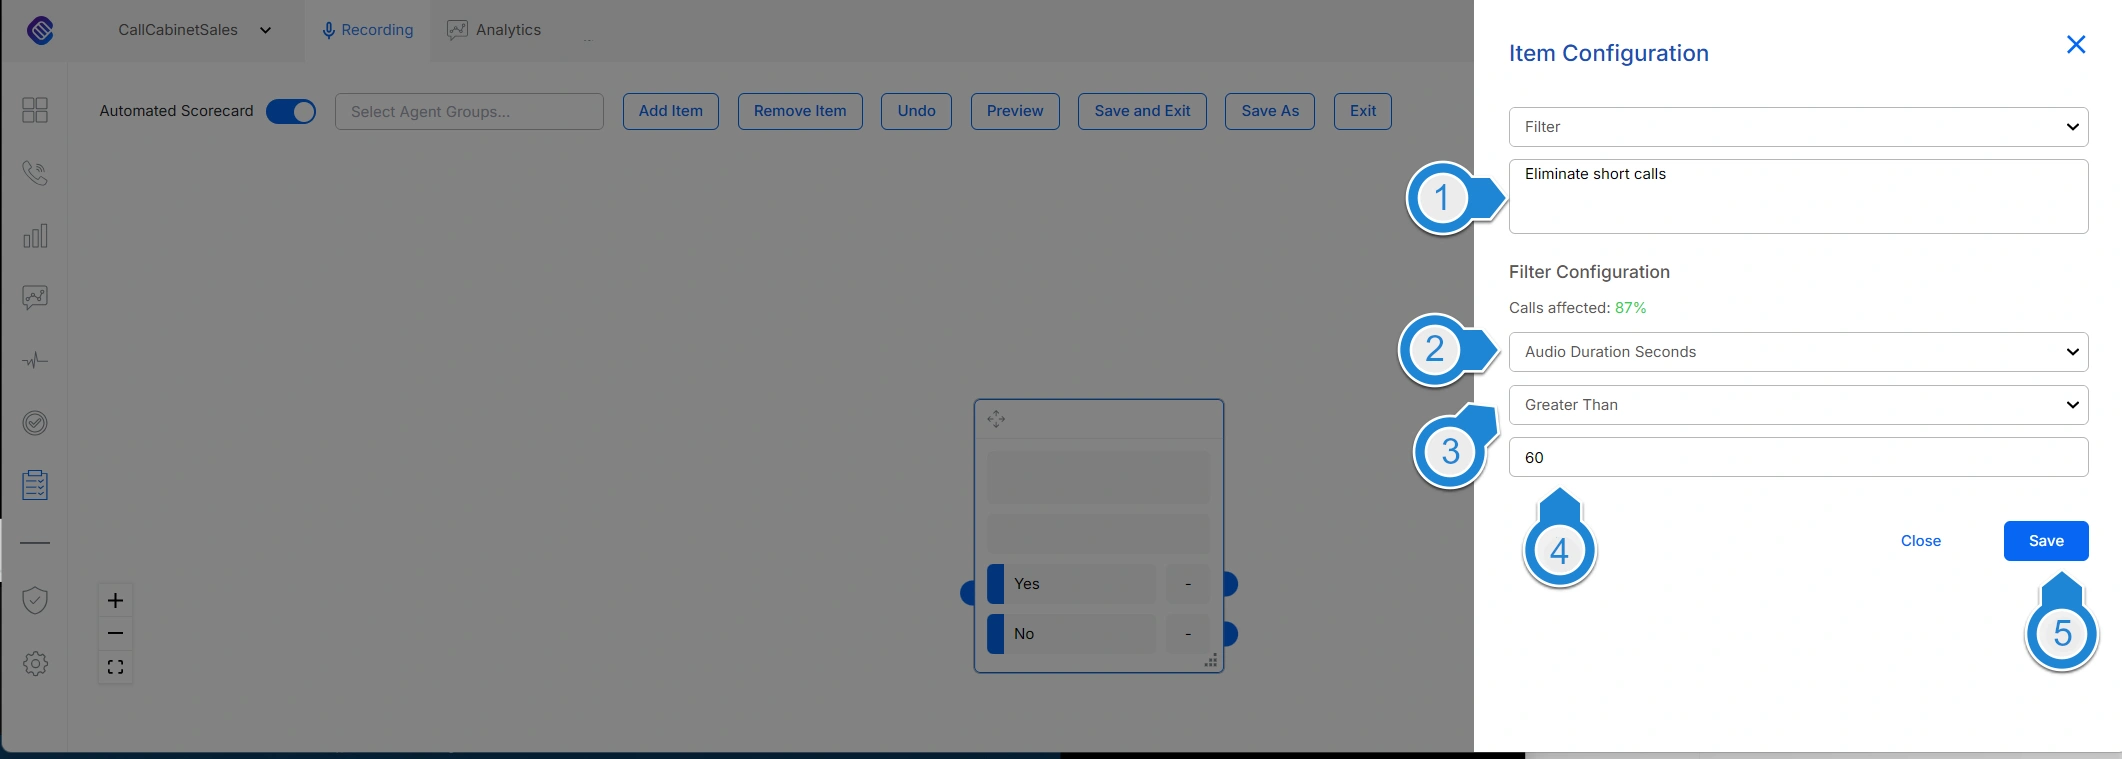
Figure – Filter Item Configuration
The user enters the required parameters that will be applied to this Filter.
- The user may enter a description of the purpose and function of the Filter.
- The user would then, from the Select Filter dropdown list, select Audio Duration Seconds.
- The user enters the required parameters that will be applied to this filter, which for our selected filter type would be Less Than or Greater Than. For this example, Greater Than should be selected.
- The user then enters the duration. For this example, the call must be longer than 60.
- Once the user is satisfied with the configuration, they must click the Save button to save the filter.
Once done, the filter will be rendered on the canvas in the scorecard editor. The user may now add a topic to the scorecard that will be applied if the filter’s criteria are matched. To do this the user clicks the Topic item, this will result in a new dialog appearing as illustrated below.

Figure – Topic Item Configuration
- The user enters a description of the purpose and function of the Topic.
- The user enters the section that this Topic belongs to
- The user then enters the call’s direction. It may be incoming, outgoing or both directions.
- The user selects the channel that this topic should be applied to, which may be one of the following;
- Agent
- Customer
- Both Channels
- The user is required to establish at what point in the call should this Topic be applied. The Select Assessment Period filter options are options are;
- First Seconds. Incidentally, this defaults to 30 seconds.
- Between First and Last Seconds. Incidentally, this defaults to 30 seconds after the call starts up to 30 seconds before the call ends.
- Last Seconds. Incidentally, this defaults to 30 seconds.
- Entire Call.
- Once the assessment period has been decided the user must stipulate for how long, starting at the Selected Assessment Period entered (see 5 above), this Topic should be applied.
- The word and word phrases that the user wants applied to this Topic must be entered into this field.
- The tolerance of the phrases may be set using the tolerance slider. This slider determines the number of additional words allowed in a phrase. For example, if the word phrase is ‘You have reached’ and the user has set a tolerance of four, then four words may appear between the word phrase and still be valid.>
- Clicking on Check Hit Rate will indicate the percentage hit value the entered phase would experience across all current calls. The user may use this feature to observe the current effectiveness of the phrase entered.
- If the user is content with the phrase, they may add it to the current phrase list by clicking the Add button.
Incidentally, the Hit Rate section provides an indication of the hit rate achieved across all calls for all of the phrases listed in the section. As a simple example, the keyword ‘registration’ was only hit across 4% of all the calls. This provides excellent feedback as to how effective the word and word phrases are across all calls. This allows for fine tuning of the phrases;
- It is possible for an admin user to upload a file containing word phrases. The format of this file is a text file that is line delimited, where each line contains the word or word phrase (sentence) that should be applied to the Topic being defined. For example;
paint
color
scratch
When the admin user clicks the upload icon, the dialog, illustrated in Figure – Upload Phrases appears. The user may drag-and-drop the pass-phrase text file, from their local machine, into the ‘Upload New Phrases’ section. Once done the user presses the Upload button. All the phrases contained in the file will be imported and applied to the selected Topic. Incidentally, the user may download, to their local computer, the current pass phrases associated with the Topic, by clicking the download button in the Figure – Upload Phrases dialog. The Upload/Download of Phrase Packs feature streamlines the scorecard development process by allowing users to quickly import and export large sets of pre-defined phrases. This functionality accelerates workflows, ensuring consistent and error-free evaluations while enhancing productivity by making it easier to manage and share phrase packs in bulk.Once the user is satisfied with the configuration of the Topic, they must click the Save button to save the Topic and its configuration.

Figure- Upload Phrases
Should the user want to add a question they would click the Add Item button and then from the Select Item Type dropdown select Question. This will then result in a similar configuration dialog as that rendered for a Topic appearing in the view, but this time it relates to configuring a question. This is illustrated in Figure – Question Item Configuration.

Figure – Question Item Configuration
There are two additional fields that require information compared to those when creating a Topic. These are;
- The user enters the Question that is to be ‘automatically’ asked
- The user enters the Question Hint that should be applied to this question. This hint would be used when manual overriding of the automatic scoring process to assist the user to understand the purpose of the question and what it is ‘asking’.
- The user enters the section that this Question belongs to.
- The user then enters the call’s Direction. It may be incoming, outgoing or both directions.
- The user selects the channel that this Question should be applied to, which may be one of the following;
- Agent
- Customer
- Both Channels
- The user is required to establish at what point in the call should this Question be applied. The Select Assessment Period filter options are;
- First Seconds. Incidentally, this defaults to 30 seconds.
- Between First and Last Seconds. Incidentally, this defaults to 30 seconds after the call starts up to 30 seconds before the call ends.
- Last Seconds. Incidentally, this defaults to 30 seconds.
- Entire Call.
- Once the assessment period has been decided the user must stipulate for how long, starting at the Selected Assessment Period entered (see 6 above), this Question should be applied
- The weight (or mark) applied to the question. For example, if the question is ‘Did the agent use profanity?’ then a negative weight of -100 could be applied to the Yes field if the agent did, otherwise a positive value of 50 could be applied to the No field.
- The word and word phrases that the user wants applied to this Question must be entered into this field.
- The tolerance of the phrases may be set using the tolerance slider. This slider determines the number of additional words allowed in a phrase. For example, if the word phrase is ‘You have reached’ and the user has set a tolerance of four, then four words may appear between the word phrase and still be valid. Incidentally, the tilde ~ takes precedence over this tolerance slider
- Clicking on Check Hit Rate will indicate the percentage hit value the entered phase would experience across all current calls. The user may use this feature to observe the current effectiveness of the phrase entered.
- If the user is content with the phrase, they may add it to the current phrase list by clicking the Add button.
Incidentally, the Hit Rate section provides an indication of the hit rate achieved across all calls for all of the phrases listed in the section. As a simple example, the word phrase ‘this is’ was hit across 70% of all the calls. This provides excellent feedback as to how effective the word and word phrases are across all calls. This allows for fine tuning of the phrases;
- It is possible for an admin user to upload a file containing word phrases. The format of this file is a text file that is line delimited, where each line contains the word or word phrase (sentence) that should be applied to the Question being defined. For example;
Agree with you ~3
Can understand ~2
Completely understand ~4
When the admin user clicks the upload icon, the dialog, illustrated in Figure – Upload Phrases appears. The user may drag-and-drop the pass-phrase text file, from their local machine, into the ‘Upload New Phrases’ section. Once done the user presses the Upload button. All the phrases contained in the file will be imported and applied to the selected Question. Incidentally, the user may download, to their local computer, the current pass phrases associated with the Question, by clicking the download button in the Figure – Upload Phrases dialog. The Upload/Download of Phrase Packs feature streamlines the scorecard development process by allowing users to quickly import and export large sets of pre-defined phrases. This functionality accelerates workflows, ensuring consistent and error-free evaluations while enhancing productivity by making it easier to manage and share phrase packs in bulk. - Once the user is satisfied with the configuration of the Question, they must click the Save button to save the Question and its configuration.
The user may link the Filters, Topics and QA Questions together by clicking on the bubbles next to each of these entities. See the Manual Scorecard creation section on how to do this. Below is an example of a Filter, Topic and QA Question linked together.

By using Filters, Topics and QA Questions in a meaningful and creative manner allows for a very dynamic and effective way to automatically assess calls. The user has huge control over their business rule flow. The more time spent creating and fine tuning the correct flow as well as tweaking the word and word phrases the more accurate and effective automatic Quality Assurance will become.
Security Log
NOTE: An Advanced User License, Administrative user role, Quality Assurance Analyst License or Quality Assurance Admin License is needed to access the Security Log page
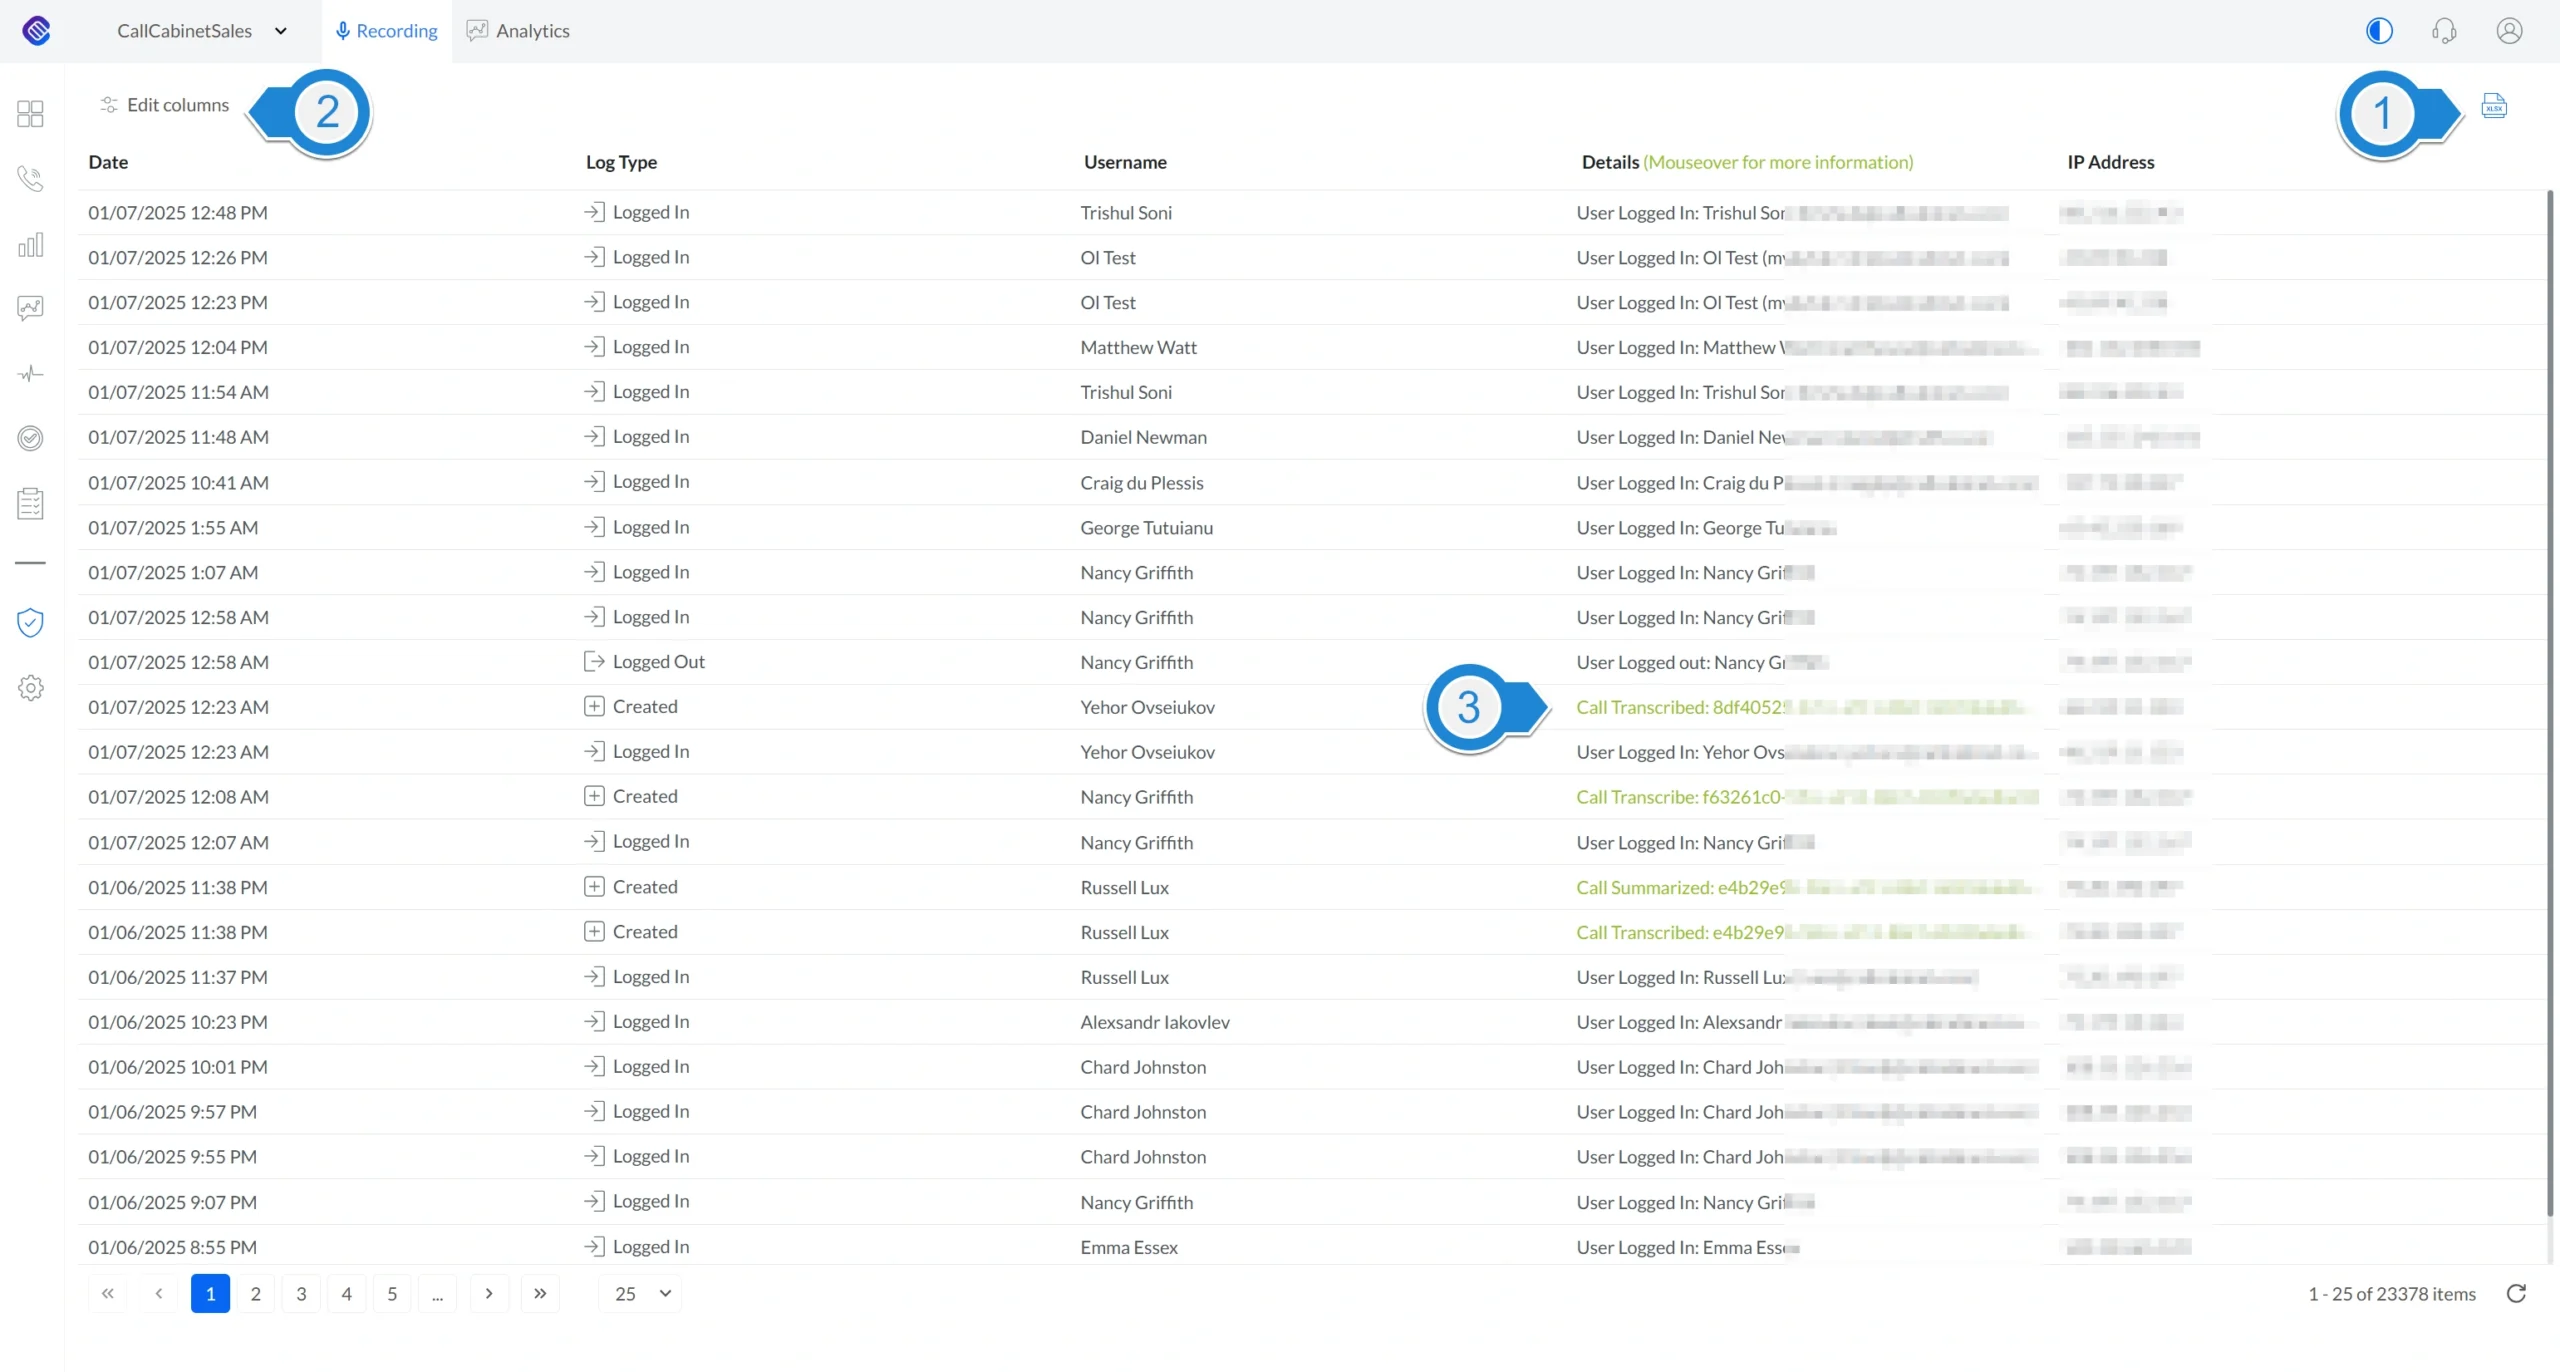
Figure – Security Log
The Security Log page displays information regarding all changes made to the system, including access and playback details. The data table will show the current logged-in user the Date and Time, Log Type, User’s Name, Details, and IP Address of each security and playback event within CallCabinet. A user may add or delete these columns by clicking on Edit columns highlighted by 2 in Figure – Security Log. Incidentally, these five columns are the only columns available for viewing on the Security Log page. Each column in the data table can be sorted by clicking on the column name and filtering can be applied by clicking on the icon![]() adjacent to the column heading which appears as the user passes their cursor over the column’s name the user is wanting to apply the filter. In the associated dialog that appears, the user will enter the criteria that are to be applied to the filter to produce the desired result.
adjacent to the column heading which appears as the user passes their cursor over the column’s name the user is wanting to apply the filter. In the associated dialog that appears, the user will enter the criteria that are to be applied to the filter to produce the desired result.
Should the user hover over the green text, indicated by 3 in Figure Security Log, a dialog box appears displaying verbose information about that particular call.
NOTE: Clicking the Excel ![]() icon, highlighted by 1 in Figure Security Log will result in the exporting of all the current displayed page’s data.
icon, highlighted by 1 in Figure Security Log will result in the exporting of all the current displayed page’s data.
Settings
When clicking on the settings item in the menu, a submenu is revealed. Each of these submenu items are discussed in detail in the following sections. The settings section of CallCabinet may be viewed as the admin section of the application.
NOTE: An Admin, Super Admin or a Support User Role is required to access the various Settings pages. A support user has limited access to the Settings pages.
General Settings
The General Settings page allows Admin, Super Admin and Support users to manage the overall settings that govern the entirety of CallCabinet for your organization. Settings that are edited will be reflected for all users, regardless of user role or licensing permissions. This view is made up of five tabulated views, as illustrated by Figure General Settings Tabs. Each of these views is discussed below.

Figure – General Setting Tabs
1. Company Information
This tab’s view is rendered when a user clicks on the ‘Company Information’ tab indicated by 1 in the screen image illustrated in Figure menu above. The rendered screen looks as follows:
The purpose of each field is:
- Company Email: The email address associated with your organization’s CallCabinet account. Generally, you will create a distribution email account for this.
- Company Address: The physical location of your organization.
- Company City: The city in which your organization is located.
- Company State: The state in which your organization is located.
- Company ZIP: ZIP Code of the location of your organization.
- Company Phone No: The phone number associated with your organization’s CallCabinet account.
If a user makes changes to any of these fields, the Update button is automatically enabled, allowing the user to click it and save them.
2. Security Settings
This tab’s view is rendered when a user clicks on the ‘Security Settings’ tab indicated by 2 in the screen image illustrated in Figure menu above. The rendered screen looks as follows:
The purpose of each field is:
- Two Factor Authentication: This determines the multi-factor authentication option. By clicking on the dropdown, currently three options are available to the user; App MFA, which is recommended, Email MFA or No MFA.
- Business Contact: This is a very important field in which the admin user should enter a customer’s business distribution email account. CallCabinet will use this email address when sending business incident emails to recipients who have access to this email. It is important that a user does not enter an individual’s email address. The reason for this is if that user no longer belongs to the company, then any emails sent by CallCabinet may not be read. Having a distribution email account ensures that anyone who has access to the account will receive the email.
- Compliance Contact: This is a very important field in which the admin user should enter a customer’s compliance distribution email account. CallCabinet will use this email address when sending compliance incident emails to recipients who have access to this email. It is important that a user does not enter an individual’s email address. The reason for this is if that user no longer belongs to the company, then any emails sent by CallCabinet may not be read. Having a distribution email account ensures that anyone who has access to the account will receive the email.
- Finance Contact: This is a very important field in which the admin user should enter a customer’s finance distribution email account. CallCabinet will use this email address when sending finance incident emails to recipients who have access to this email. It is important that a user does not enter an individual’s email address. The reason for this is if that user no longer belongs to the company, then any emails sent by CallCabinet may not be read. Having a distribution email account ensures that anyone who has access to the account will receive the email.
- Disable Classic Login: By ticking this checkbox, a user will not be able to log in using their email address and a password. However, it allows for single sign-on (SSO) using Gmail, Google Apps, Windows Azure, or Okta username that matches the user’s specified email address in CallCabinet.
- Download Calls: By ticking this checkbox, a user with the requisite licensing will be able to download call recordings from the Call Listing and Call Details
- Email Calls: By ticking this checkbox, users with the requisite licensing will be able to email the call ID and other metadata directly from the Call Listing and Call Details
- Be Idle For: Defines, in minutes, how long a user, who is logged into CallCabinet, may be inactive on a screen. Once the time limit has expired, the user will be automatically logged out of CallCabinet. The reason for this is security.
- Share Calls: By ticking this checkbox, users with the requisite licensing will be able to compliantly share a call recording and selected metadata from the Call Listing and Call Details
NOTE: Download Calls, Email Calls and Share Downloadable Call features may result in a compliance violation depending on the regulations governing your industry and your organization. Check with your Compliance Officer or legal department about your specific security needs before using these features.
If a user makes changes to any of these fields, the Update button is automatically enabled, allowing the user to click it to save these changes.
3. Quality Assurance Settings
This tab’s view is rendered when a user clicks on the ‘Quality Assurance Settings’ tab indicated by 3 in the screen image illustrated in Figure menu above. The rendered screen looks as follows:
If you have purchased a Quality Assurance (QA) license and are going to allow users to perform QA on your agents, then it is in this section that you set the various QA features. The purpose of each field is:
- Email Agent on Eval: Ticking this checkbox allows a QA user to email the agent the report after completing a QA evaluation. The options that you may select are; No Mail, Share or Share With Call Audio.
- QA Email Message: You may enter a ‘pre-canned’ message in this field, which will be included in the email to the agent if Email Agent on Eval option has been enabled (ticked).
- QA Score Rounding Points: An admin user may set the number of decimal places required in a QA’s percentage score. The number of decimal positions required may be selected from the dropdown, where the minimum is 0, resulting in an integer value for example 45%, 67%, 88 and. the maximum selectable resolution being 4 decimal places resulting in a real value, for example 45.0001%, 67.0072%, 88.1536%.
- Email Manager on Completed QA: Ticking this checkbox allows a QA evaluator to automatically email the complete evaluation and results to the agent’s specified manager. Managers can be specified per agent on the Agent Management page by clicking on the Settings > Agent Management menu item.
- Don’t Grey out QA Questions: Ticking this checkbox will not grey out QA questions as they are completed during the evaluation.
- Show Completion Percentage: Ticking this checkbox allows for the displaying of the percentage of progress completed by a user (supervisor) before finishing the QA evaluation.
- Show Running Score: Ticking this checkbox allows for the displaying of the current score the agent is achieving as the user (supervisor) progresses through the QA evaluation.
- Include Screenshots in QA Completed Email: Ticking this checkbox results in any screenshots being included in the email sent to the agent’s specified manager mentioned above.
If a user makes changes to any of these fields, the Update button is automatically enabled allowing the user to click it to save them.
4. Company Settings
This tab’s view is rendered when a user clicks on the ‘Company Settings tab indicated by 4 in the screen image illustrated in Figure menu above. The rendered screen looks as follows:
The purpose of each field is:
- Company URL: is the unique URL that was created for your organization’s access to CallCabinet, for example, https://artworks1.callcabinet.com.
- Send Weekly Email: refers to the weekly storage email updates. By ticking the checkbox in an email is sent each week to the address specified in the Company Email field entered under the Company Information widget.
- WIN Authorized Endpoint: permits the admin to select, via the drop-down menu, whether single sign-on (SSO) is through Azure B2C IDP, Live, NTLM or Office 365.
- Select Download Format: selects the audio format an audio file will be downloaded as. The required option is selected from the drop-down menu and the user may choose between an MP3, PCM WAV or the original audio file format.
- Company Date Format: determines the date and time formats (and durations) displayed in CallCabinet.
- Export Date Format: determines the date display format in the exported data files. The required option is selected from the drop-down menu. The current options are MinutesSeconds or TotalSeconds.
- Storage Location: refers to where your data is stored. It is set when your account was provisioned and may not be changed. NOTE: Please contact your service provider should you need to change or update your storage location if your account is a storage-based plan.
- Azure SSO Claim for email: The field in the Azure Active Directory Claim that contains the email of the user. If left blank it will assume the field name “email”, which is the typical field used. However, if your implementation in Azure AD uses a different field it can be specified here. NOTE: This field should not be changed unless you experience an issue with SSO login and only after consultation with CallCabinet Technical Support.
- Include Download Name in Excel Export: Ticking this checkbox will result in the download ‘audio file’ name being included as an extra column when an Excel file is exported. This column maps the name of the downloaded audio file to the call that it is associated with.
If a user makes changes to any of these fields, the Update button is automatically enabled, allowing the user to click it and save the changes.
5. Compliant Call Share Settings
This tab’s view is rendered when a user clicks on the ‘Compliance Call Share Settings tab indicated by 5 in the screen image illustrated in Figure menu above. The rendered screen looks as follows:
It is in this section that the administrator determines what call sharing features should be available to each user that has the requisite permission. The purpose of each field is:
- Share for a Maximum of: allows a user to define how long the complaint call share link is accessible to the recipient. Clicking on the dropdown exposes the options. Currently, the time restraints are predefined as: one hour, one day, one week, one month, two months and unlimited.
- Use OTP for Shares: By ticking this checkbox a two-step authentication process is activated for the recipient receiving a compliant call share email. When the recipient clicks on the link in the compliant call share email, a second email is sent to the recipient containing an OTP (One Time Password) that they will be required to input before they can access the compliantly shared call recording. This feature provides a user with an additional layer of security as well as a compliance share log in the audit trail to log the recipient’s receipt of the call recording.
- Share General Notes: By ticking this checkbox, a user with the requisite licensing will be able to share general notes along with the recorded audio when using the compliant call sharing feature.
- Share Time-based notes when Sharing Calls: By ticking this checkbox, the user with the requisite licensing will be able to share time-based notes along with the recorded audio when using the compliant call sharing feature.
- Share Point In Time Notes when Sharing Calls: By ticking this checkbox, a user with the requisite licensing will be able to share point-in-time notes along with the recorded audio using the compliant call sharing feature.
- Share Screenshot when Sharing Calls: By ticking this checkbox, a user with the requisite licensing will be able to share agent screenshots along with the recorded audio using the compliant call sharing feature.
- Share Extensions when Sharing Calls: By ticking this checkbox, a user with the requisite licensing will be able to share extension information along with the recorded audio when using the compliant call sharing feature.
- Share Transcription when Sharing Calls: By ticking this checkbox, a user with the requisite licensing will be able to share the speech-to-text transcription along with the recorded audio using the compliant call sharing feature.
- Share Downloadable Call: By ticking this checkbox, a user with the requisite licensing will be able to share a downloadable copy of the recorded audio when using the compliant call sharing feature. NOTE: CallCabinet DOES NOT recommend checking the Share Downloadable Call checkbox to ensure that your compliant call share feature is fully compliant.
- Share Call with permission to Add Note: By ticking this checkbox, a user with the requisite licensing will be able to grant permission to the recipient to add a note to the call share. Incidentally, when the recipient does add a note, the user that sent the call to the recipient will receive an email alerting the user to the fact that a recipient added a note to the call.
NOTE: Download Calls, Email Calls and Share Downloadable Call features may result in a compliance violation depending on the regulations governing your industry and your organization. Check with your Compliance Officer or legal department about your specific security needs before using these features.
If a user makes changes to any of these fields, the Update button is automatically enabled, allowing the user to click it to save them.
User Management
NOTE: An Admin User Role, Super Admin User Role, or a user that has been assigned a Custom User Role that has permission to access the Settings and User Management page, is required to access the Settings pages.
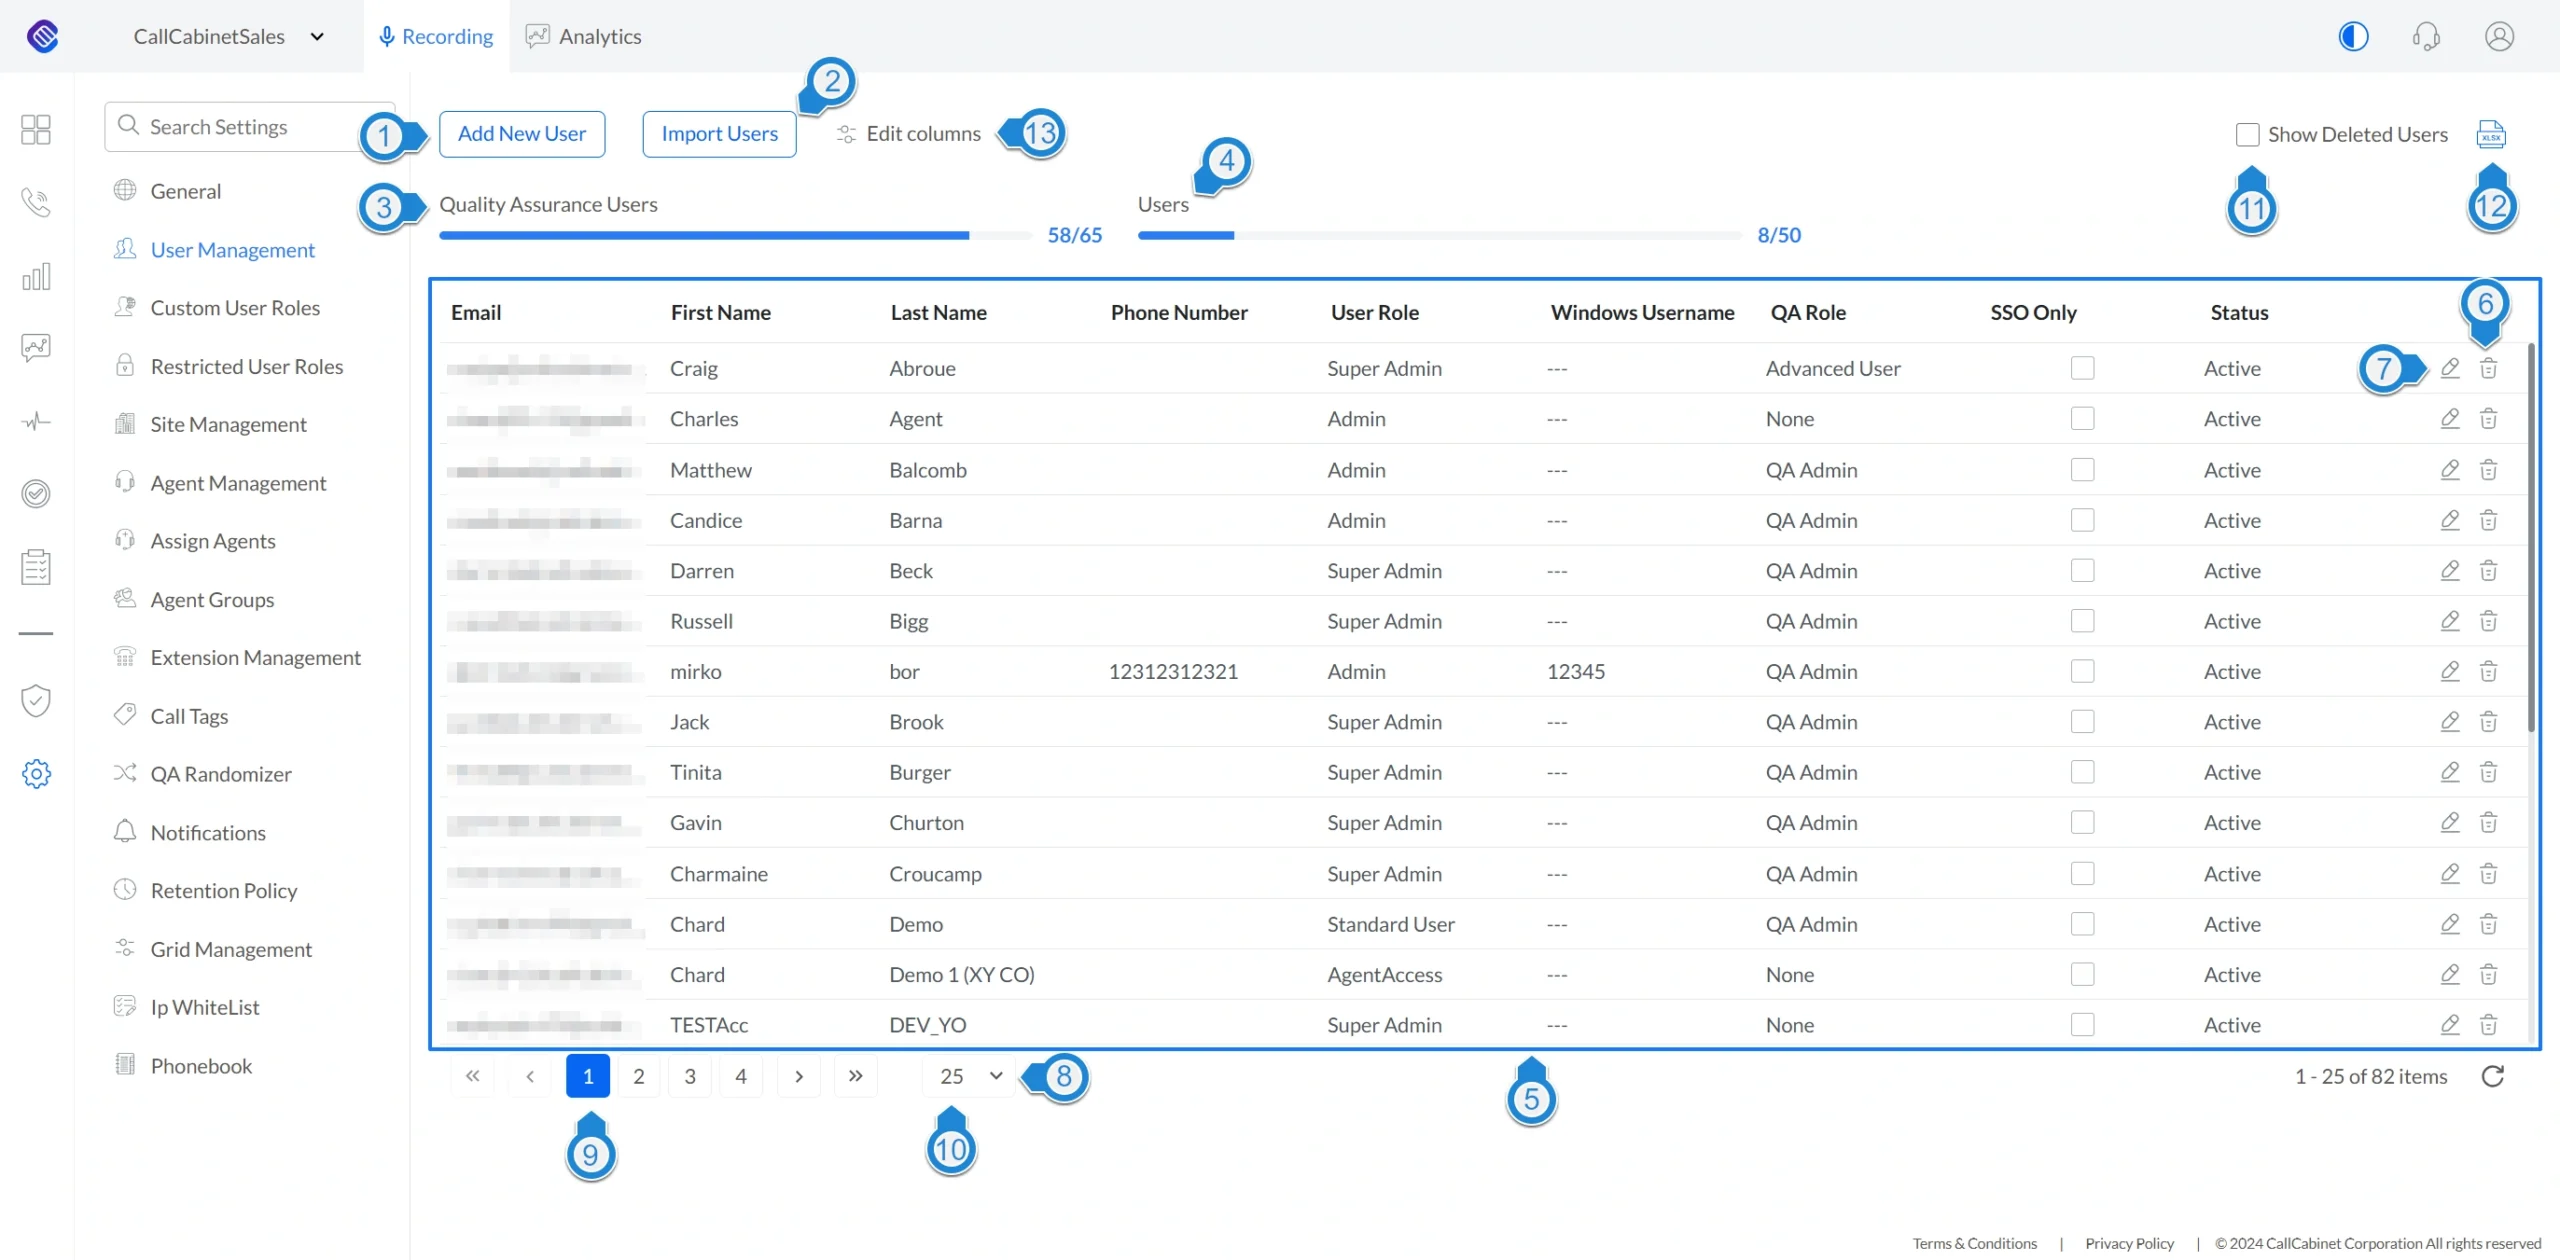
Figure- User Management
The User Management page allows a user with Admin rights to add, edit and delete users. A Support user may view and delete a user.
NOTE: Users are individuals who have login access to the CallCabinet Cloud. Depending upon the role they are assigned determines the permission they have to perform certain tasks. For instance, a user assigned the Standard User role will be able to review call recordings as well as view in depth details about the call. Whereas, a user assigned the Support User role will not see these features. We will discuss roles and permissions in the next chapter. In this chapter we will discuss the process of managing users.
The numbers in the discussion below relate to the screen image illustrated in Figure User Management:
- Add New User: Clicking this button will open a dialog box allowing the current logged-in user to add a new user. An example of this dialog is illustrated in Figure Add New User. To create a new user, the current logged in user will be required to input the new user’s Email, assign the relevant User Role selectable by a drop-down menu, assign the relevant License selectable by a drop-down menu, First Name, Last Name, Phone Number, Date Format, Notes and a Windows User Name, if required. When adding a new user, Admins may define whether the user should use SSO (Single Sign-on). If Two Factor Authentication for login is required, check this box. Two Factor Authentication multi-factor authentication options may be selected by clicking on the dropdown, currently three options are available to the user; App MFA, which is recommended, Email MFA or No MFA.
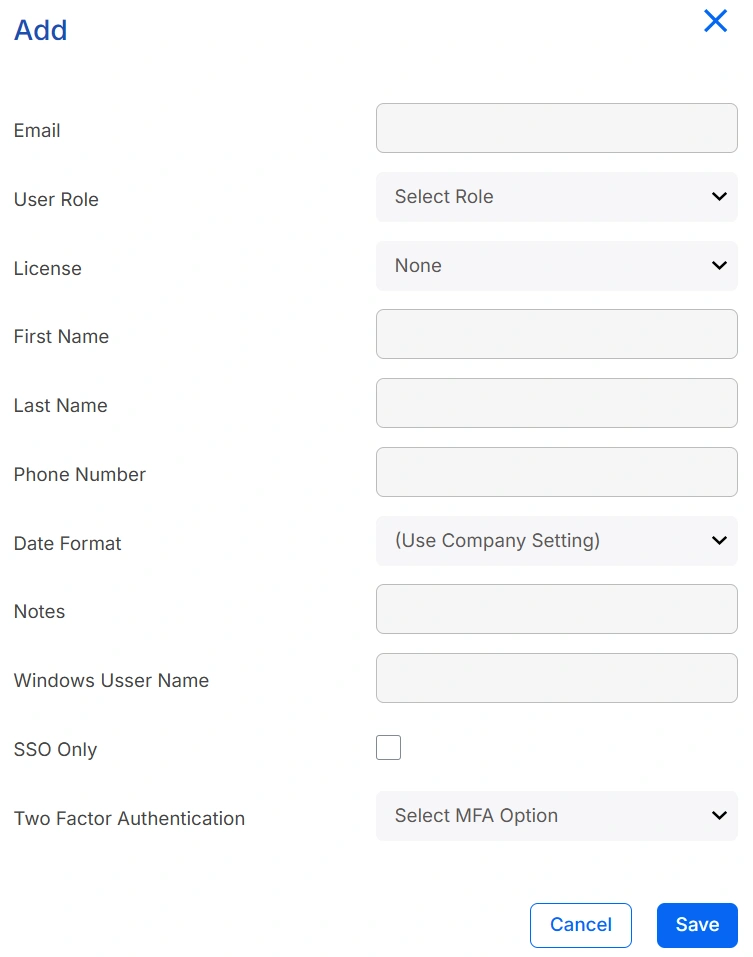
Figure – Add New User
- Users may be imported by bulk. Clicking on Import Users results in a dialog box being opened where the current logged in user may import the users. The user may download a template, complete the required fields and upload the template to perform a bulk import of user information. An example of the dialog rendered is illustrated in Figure Users Import.
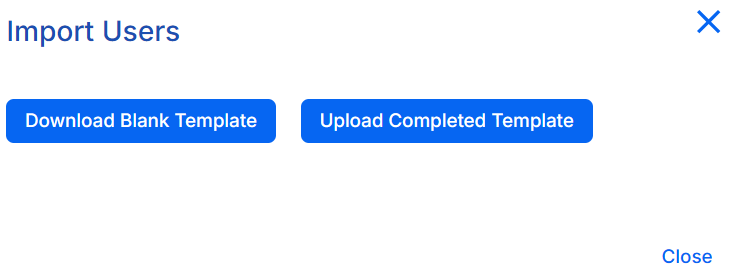
Figure – Users Import
- The Quality Assurance License Display Area displays how many QA licenses are currently in use and available (purchased). The number below the line (/) indicates the number of QA licenses purchased, whereas the number above it indicates the number of QA licenses consumed (in use).
- The User License Display Area displays how many User licenses are currently in use and available (purchased). The number below the line (/) indicates the number of user licenses purchased, whereas the number above it indicates the number of user licenses consumed (in use). Please see User Roles and Licenses table below for more information.
- The User Data Table displays a list of current users and their associated information, such as the user’s Email, First Name, Last Name, User Role, Windows Username, QA Role and current Status.
- The Trash
 icon allows users to delete a user, revoking their ability to login to CallCabinet.
 - The Edit Pencil
 icon allows a user to edit an existing user’s information and licensing
 - The Items Per Page drop-down allows a user to change the number of items returned on each page. The range is from 25 – 2000
- Number of the page currently being viewed.
- Displays the maximum number of items per page being rendered (selected by 8).
- Show Deleted Users check box, when checked, will display any previously deleted users in the user data table and allow users to reactivate the user by clicking the reactivate button. An example of this page is:
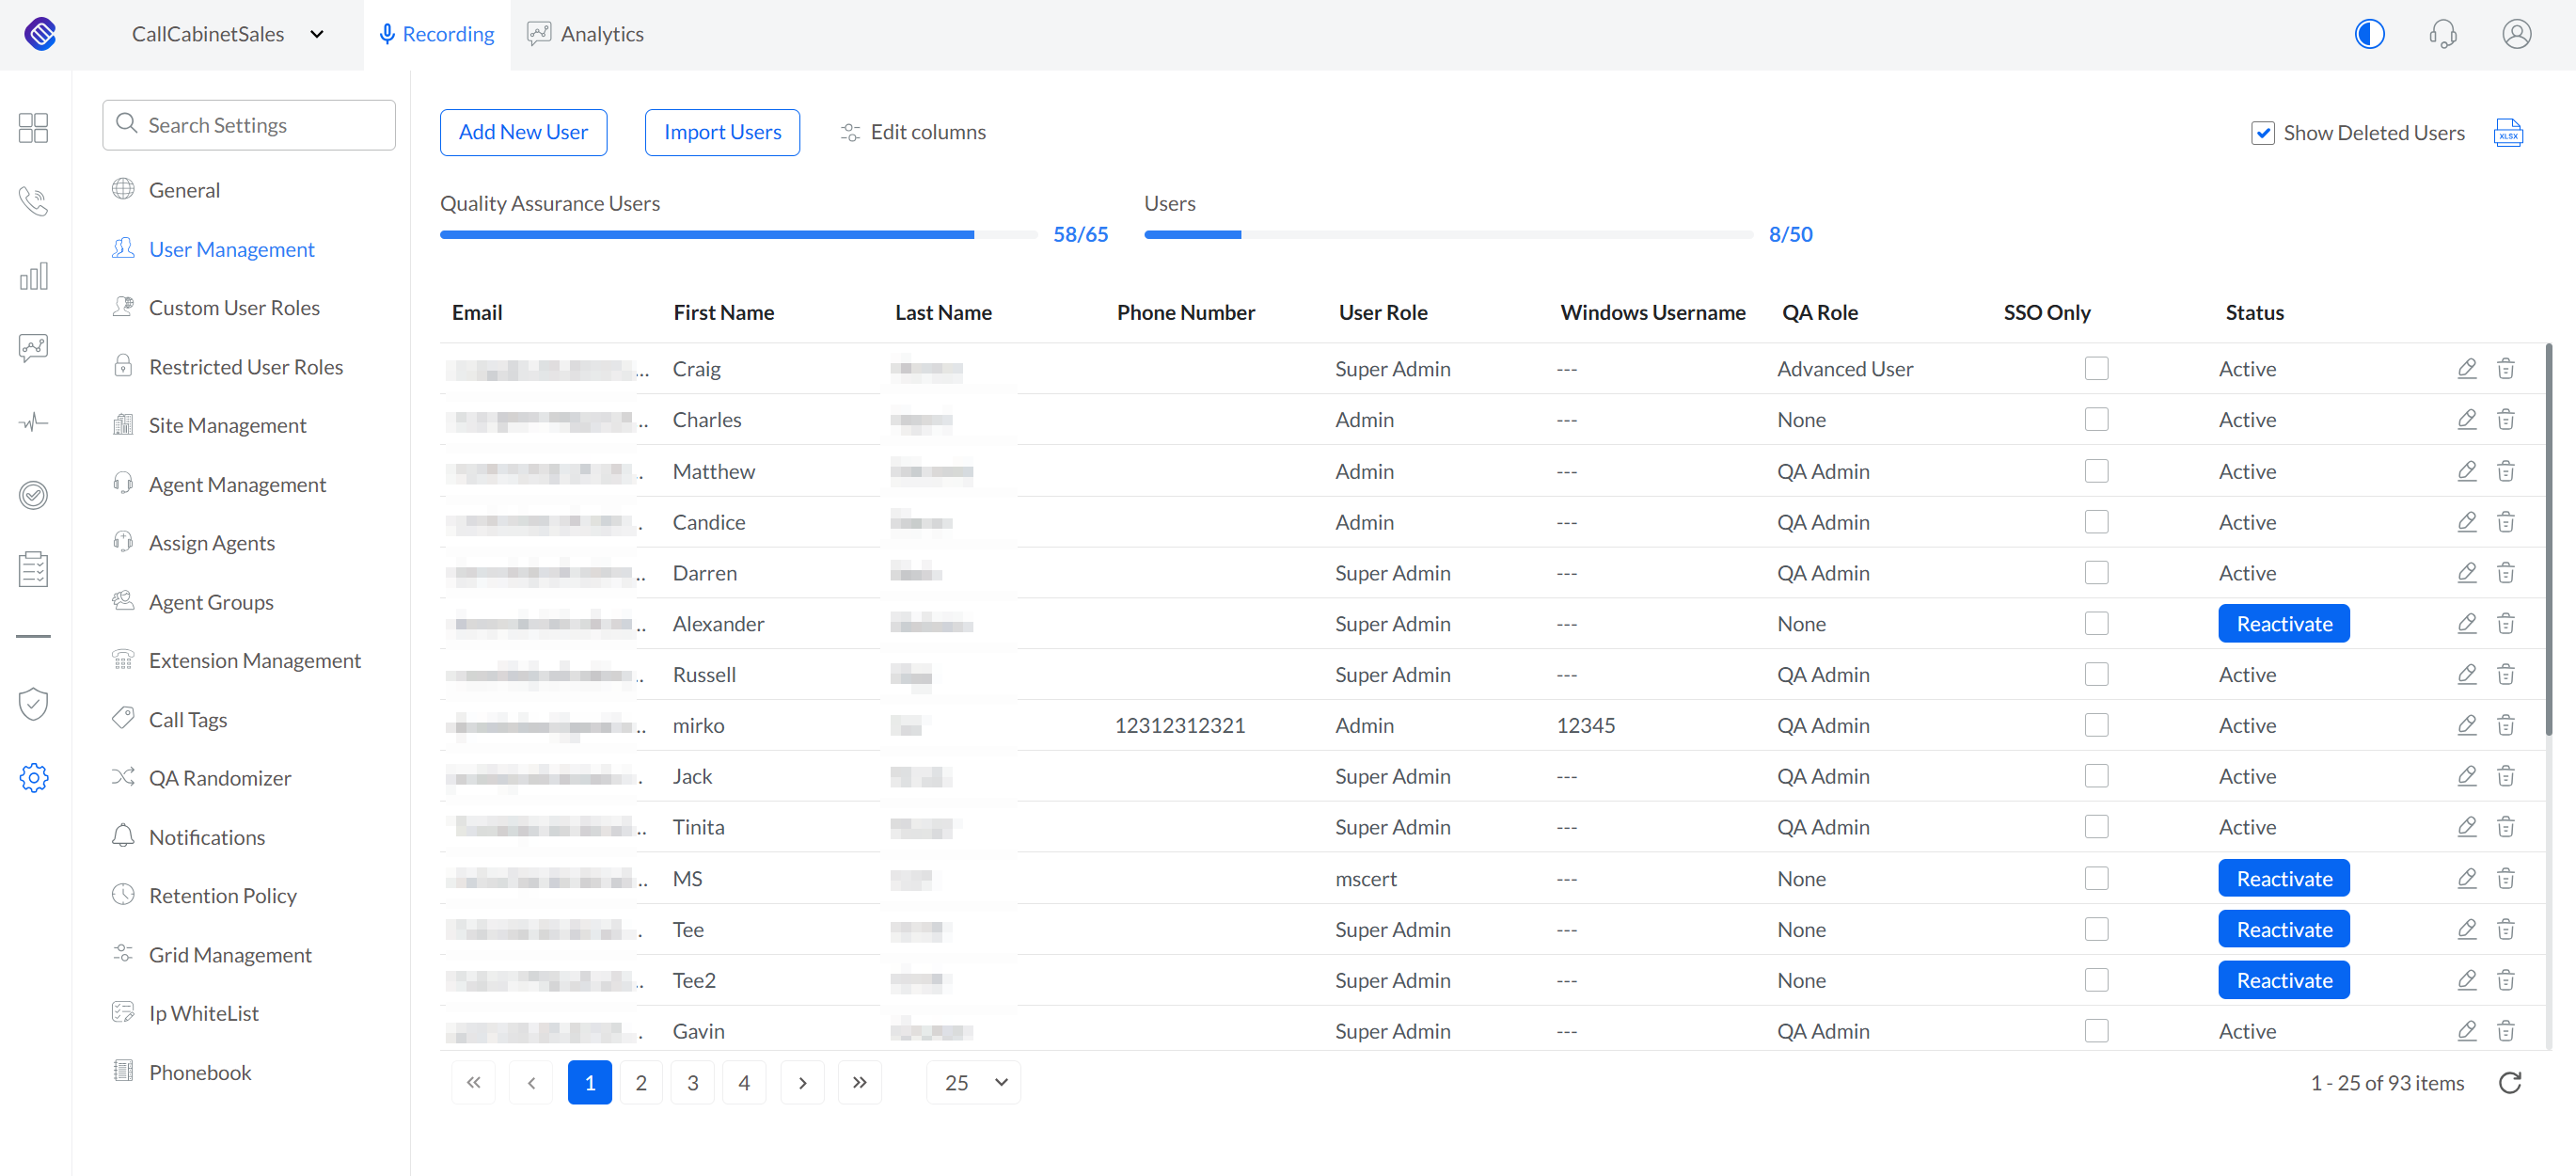
Figure – Viewing Deleted Users
- Clicking the Excel icon will result in the exporting of all the current displayed page’s data.
- Clicking on Edit Columns allow the logged in user to change the columns the user would like to be visible.
Each column in the data table can be sorted by clicking on the column name and filtering can be applied by clicking on the icon ![]() adjacent to the column heading which appears as the user passes their cursor over the column’s name the user is wanting to apply the filter. In the associated dialog that appears, the user will enter the criteria that are to be applied to the filter to produce the desired result.
adjacent to the column heading which appears as the user passes their cursor over the column’s name the user is wanting to apply the filter. In the associated dialog that appears, the user will enter the criteria that are to be applied to the filter to produce the desired result.
Custom User Roles
NOTE: Users are individuals who have login access to the CallCabinet Cloud. Each user that is created is required to be assigned a specific role. These roles grant a user access and permission to perform specific tasks on the account they are logged into.
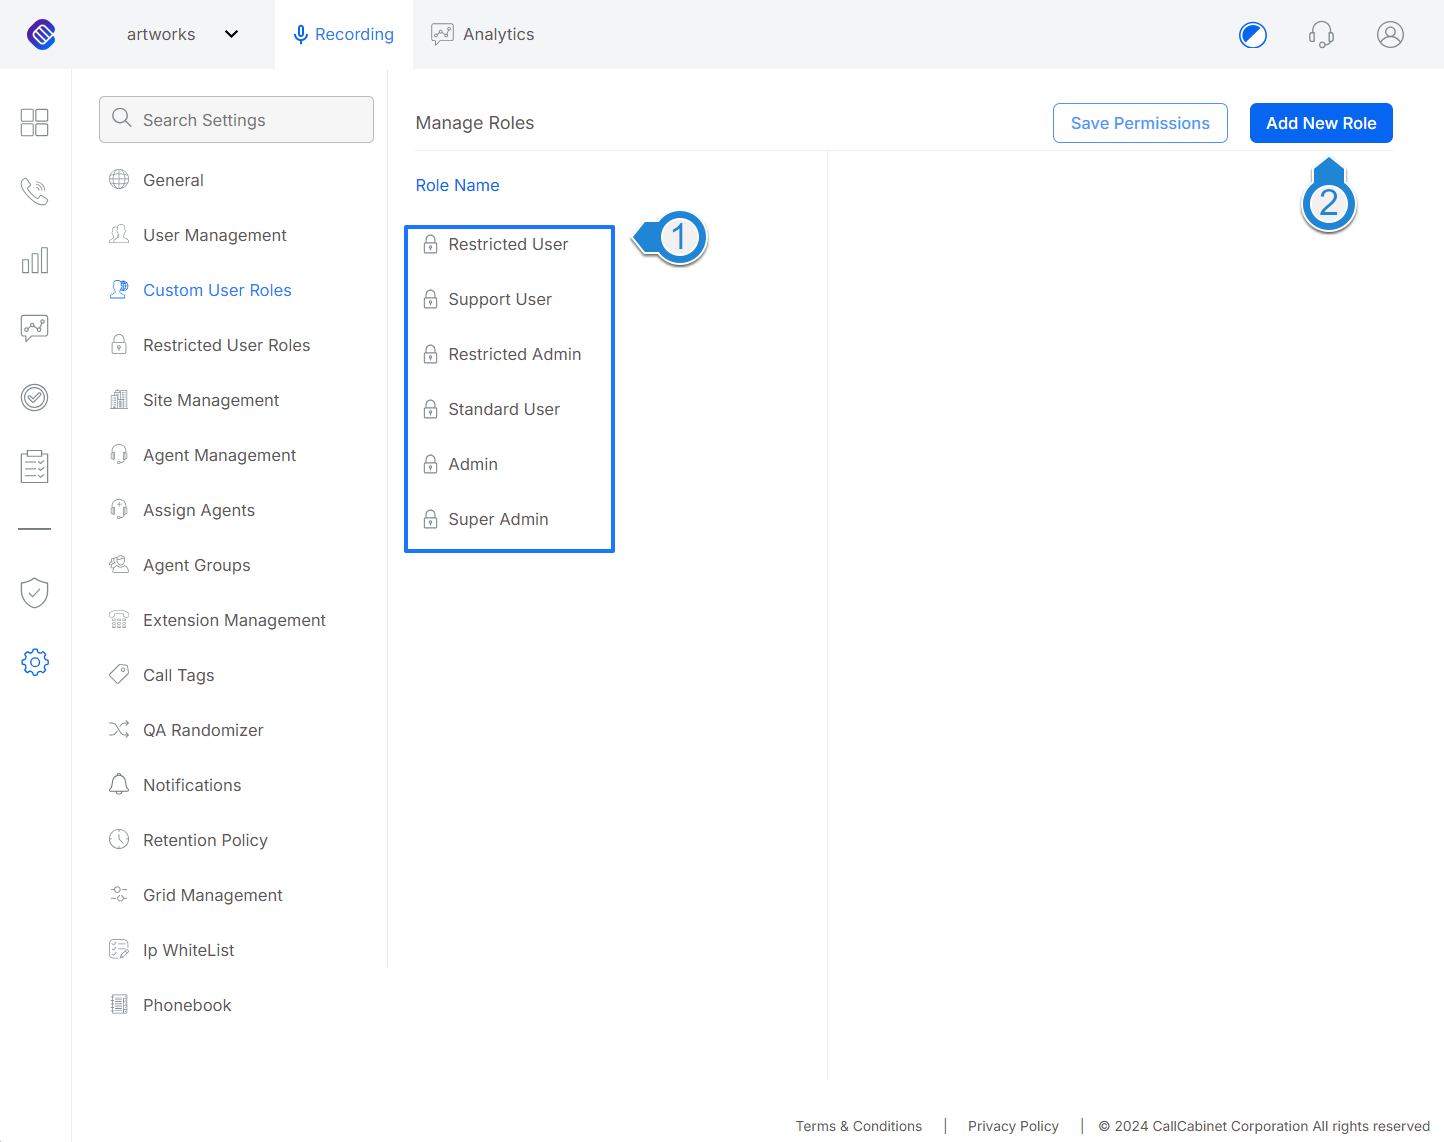
Figure – Predefined Roles
There are six predefined, non-editable user role types as illustrated by 1 in Figure – Predefined Roles. These are;
- A Support User role does not grant access to the Call Listing page. However, permissions to various settings and features, such as some general settings, QA, site, user, agent, extension, phone book retention policy and whitelist management settings are granted. As you can see, this is a support role.
- A Standard User role grants access to the Call Listing page and allows the user to filter call data and
- An Admin User role grants access to the Call Listing page as well as management of some of the system settings.
- A Super Admin role grants access to the entirety of the settings in CallCabinet and is the highest role that can be assigned.
- There are two types of restricted user roles.
- Restricted User (or Restricted Standard) role
- Restricted Admin role
Both roles can be restricted to Agent(s), Group(s) or Site(s). Please see the section on Restricted User Roles. A complete description of each of these five roles is described under the heading Predefined Roles and Associated Permissions. In order to understand what permissions each of these predefined roles have been granted, the logged in user having the requisite permission will be able to view each of them. As an example, clicking the Standard User role button, as illustrated by 1 in Figure – Standard User Roles results in the displaying of the permissions, illustrated by 2, each one’s dependencies, if any and the licenses required for specific features, illustrated by 3, should those features be required. Every single permission and feature that is available in CallCabinet is listed, however it is those permissions whose checkboxes are checked that will be assigned to the role. The key which describes the license ‘color bubbles’ is at the top of the view as illustrated by 4 in Figure – Standard User Roles.
Essentially, there are two license types:
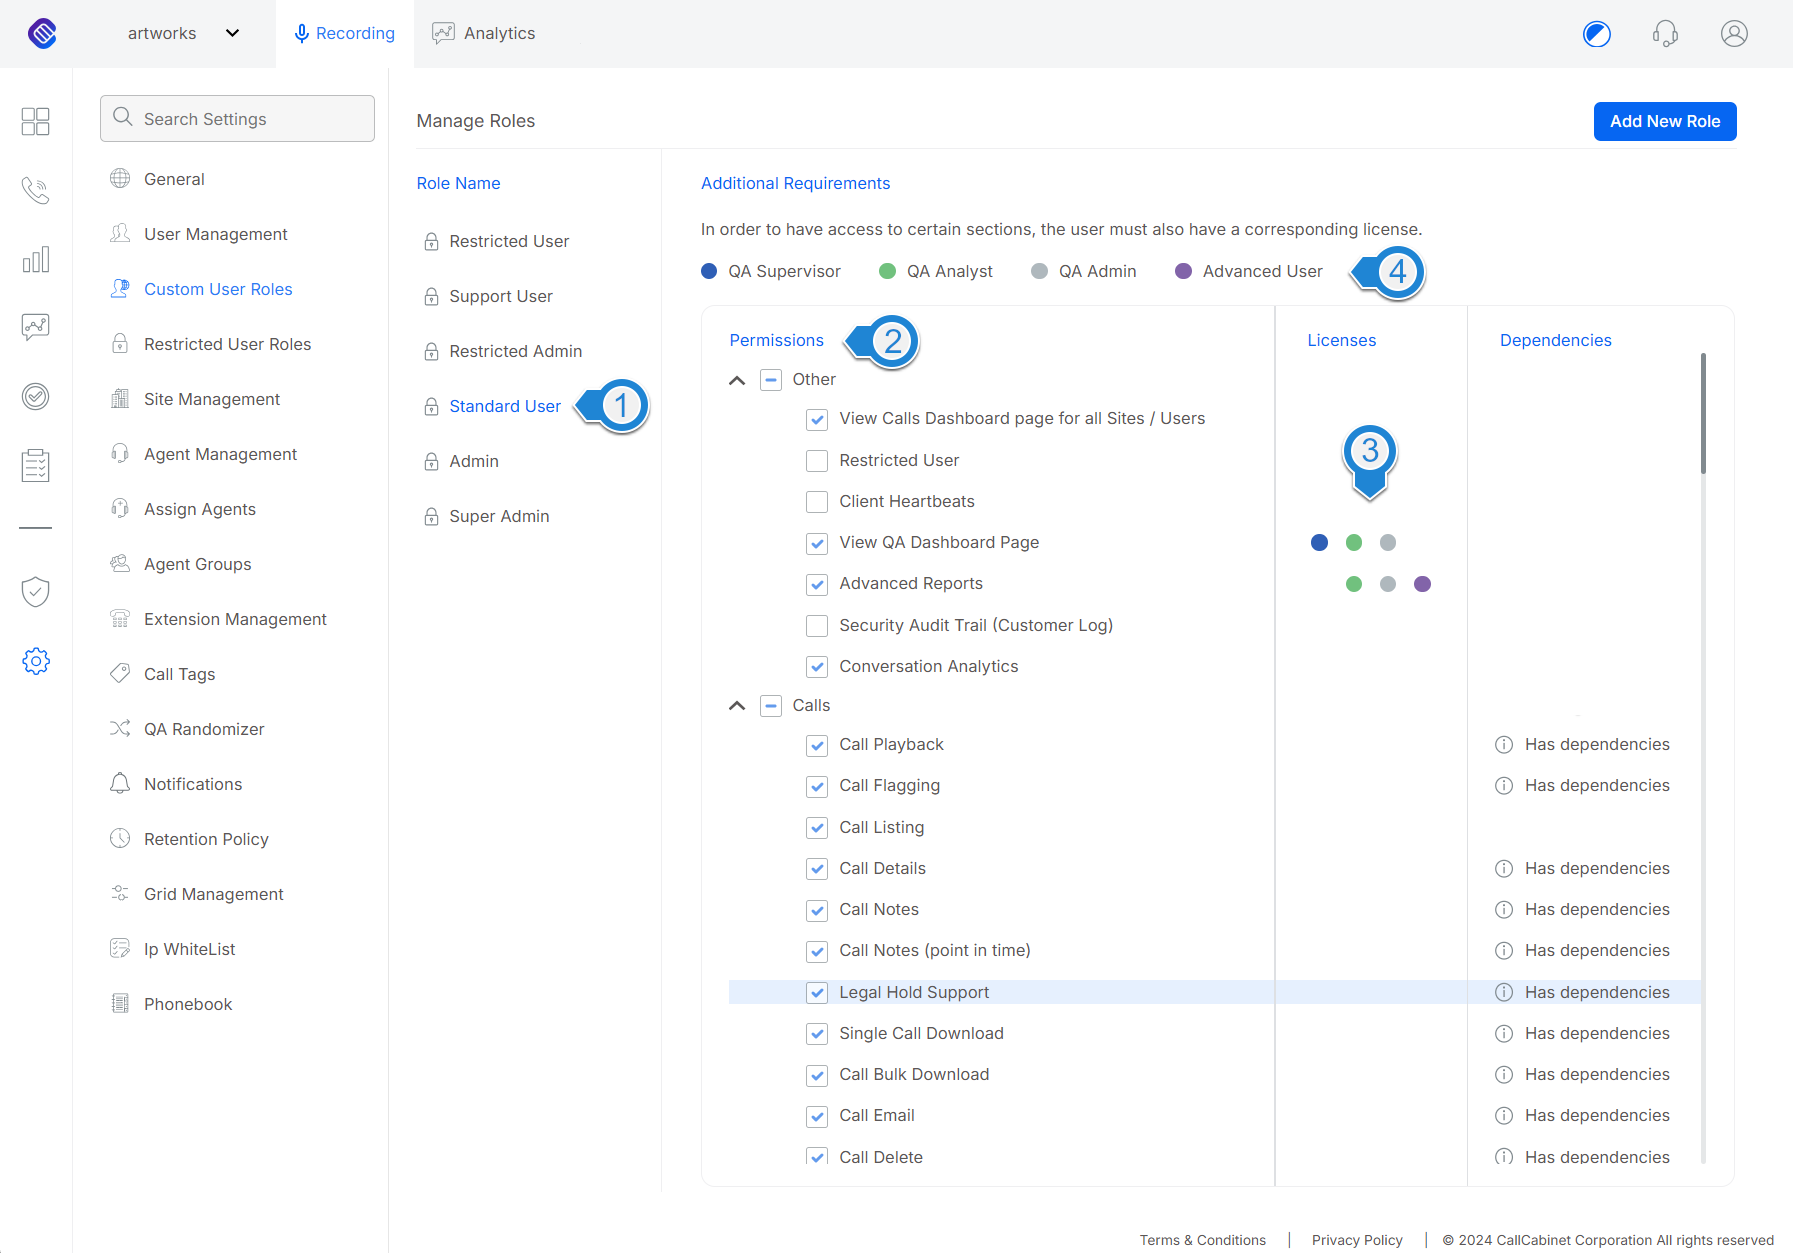
Figure – Standard User Roles
- Advanced User License. When assigned to a user it grants access to the Call Details page (if the account is on a storage plan) and Reporting functionality. For Per-Seat plan accounts there is no limit as to the number of users that may be assigned the Advanced User License. However, Storage Plan accounts must purchase these licenses as required.
- The QA License class must be purchased before it may be assigned to a user. When assigned to a user, it will grant the user access to the Quality Assurance (QA) features. There are three sub-licenses associated with the QA License. These are:
- QA Supervisor
- QA Analyst
- QA Admin
The different permission granted by each of these licenses are illustrated in Figure Quality Assurance License Features.
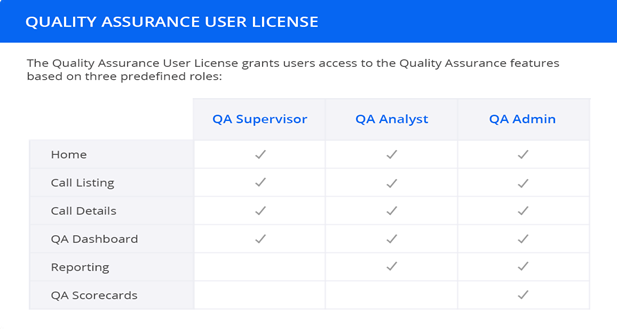
Figure – Quality Assurance License Features
Over and above the predefined roles, it is possible to create a custom role. To do so, the logged in user, who must have an Admin or Super Admin role, clicks the Add New Role on the top right side of the screen as illustrated by 2 in Figure – Predefined Roles. This will result in an Add New Role dialog appearing, as illustrated in Figure – Add New Role. The user enters the new role name, Custom Role for example and then selects Save.
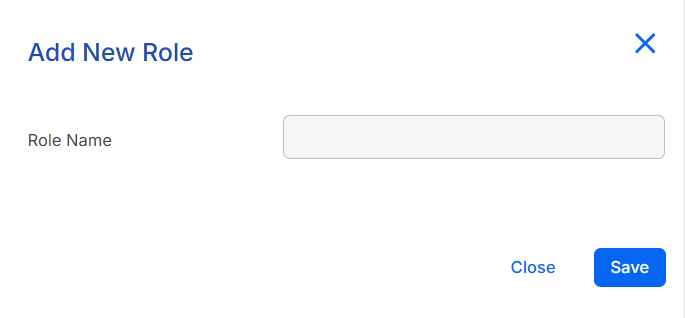
Figure – Add New Role
Once done, the new role name will appear in the Role Name column, under the predefined roles. This is illustrated by 1 in the Figure – Allocating Permissions in a Custom Role.
NOTE: Custom user roles are governed by licensing. For example: if the custom user role is to provide access to the QA features, a corresponding QA license is required.

Figure – Allocating Permissions in a Custom Role
If you study the six predefined roles created by CallCabinet you will notice each of them are granted all the Analytics and Transcription permissions. There may be times in which a use-case demands that the logged in user may not manually transcribe or summarize a call, which if they are assigned one of the predefined roles will allow them to do so. As these predefined roles are immutable, the only way around this is for an admin user to create a custom role in which the Manual Transcription and Manual Summary permissions are not enabled. The admin user may then, once enabling all the other required permissions and saving the custom role, assign the user this role thereby preventing the user from manually generating any transcriptions or call summaries.
The numbers in the discussion below relate to the image in Figure – Allocating Permissions in a Custom Role:
- The Role Name section lists the roles that have been created and saved.
- The Edit Pencil icon allows the user to edit the corresponding role.
- The Trash
 icon allows the user to delete the role. If the role has been assigned to one or more users, then the role cannot be deleted. To remove the role, ensure that any users assigned the custom role are assigned another. Once the role is no longer assigned to any users, it may then be deleted.
 - The Permissions section allows the user to assign which CallCabinet features are required to be granted to the custom role being created or edited. To enable a permission, click the checkbox alongside the required permission. Should the permission be dependent upon another permission being enabled, if that dependent permission is not already enabled, then CallCabinet will automatically enable it.
- Dependencies: To see which dependency a particular permission requires, hover over ‘Has Dependencies’ associated with the permission required. A tooltip will display containing the dependency information for the desired permission.
- Clicking on Save Permissions will save any changes made to the custom role.
Once a new user role has been created, it may be assigned to a user.
NOTE: An Admin, Super Admin or Support User Role is required to access the Settings pages.
The Figure – Restricted User Roles page allows a user to set parameters for restriction. Once a user has created
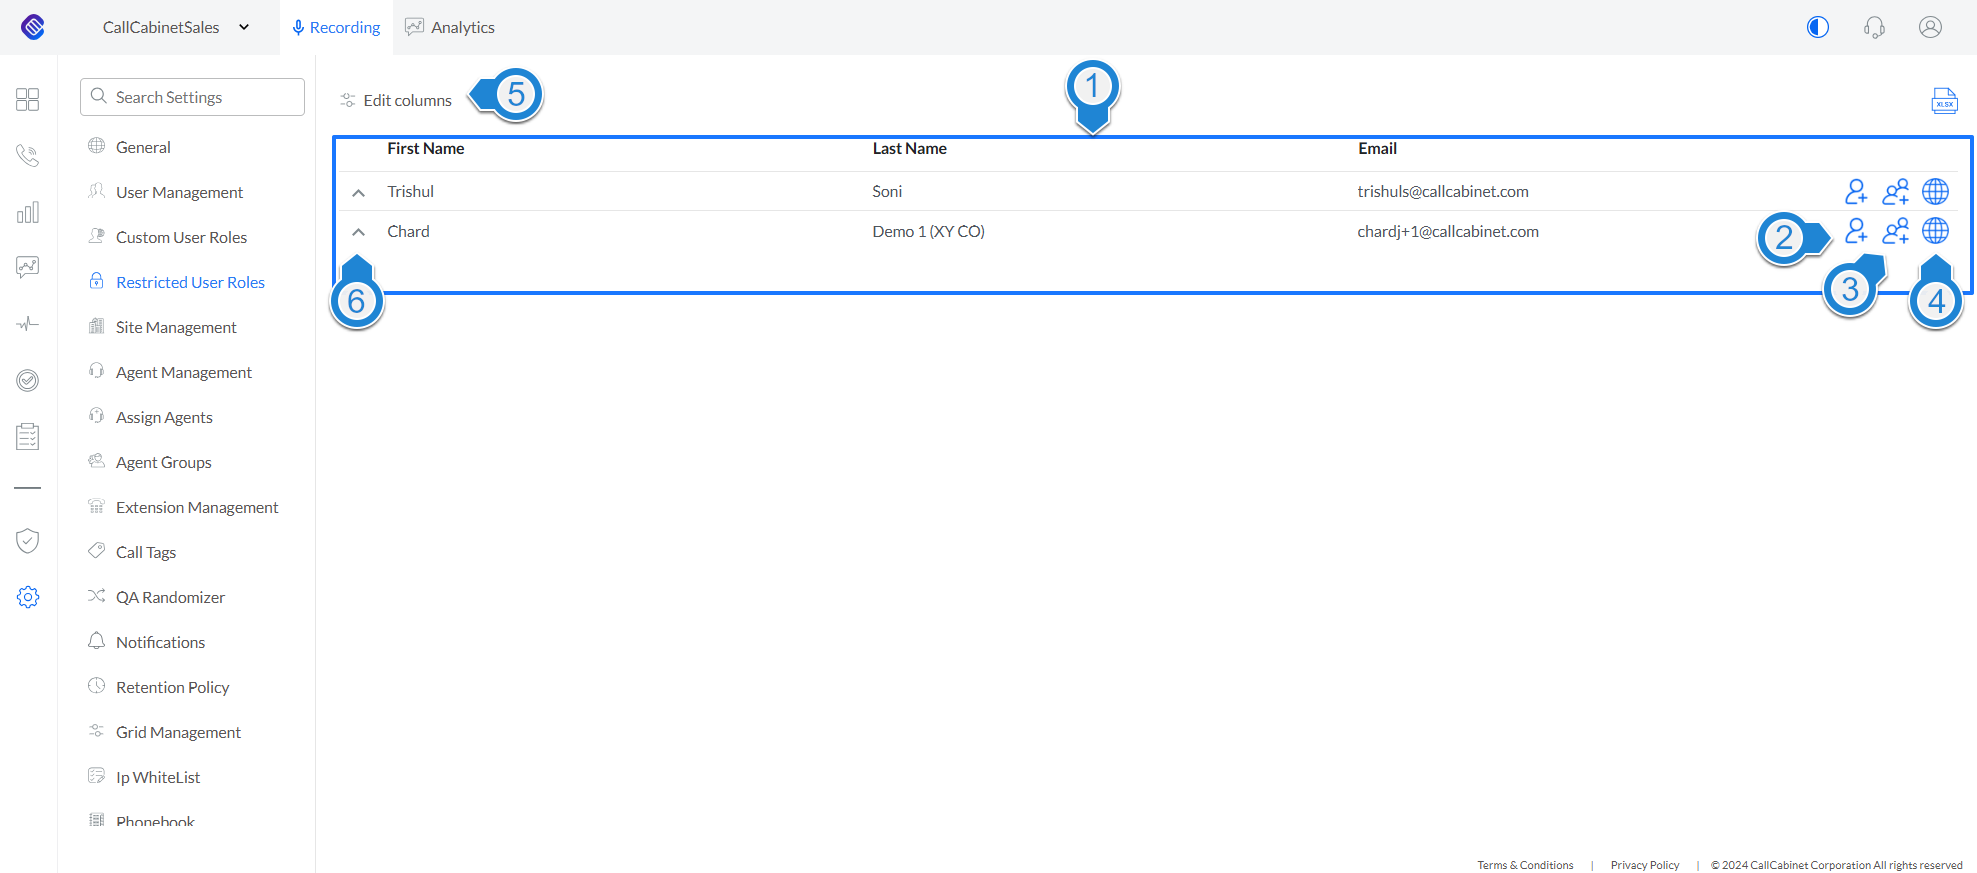
Figure – Restricted User Roles
a new user under Settings > User Management and assigned this new user a restricted user role, the user will then appear here, in the restricted user roles page.
The numbers below relate to the image illustrated in Figure – Restricted User Roles:
- The Data Table displays information associated with the restricted user. For instance, Email, First Name and Last Name.
- The Assign Agent
 icon permits the logged in user to restrict a user by agent(s). Clicking this icon will result is an Edit Assigned Agents dialog appearing which will look similar to the following;

In the dialog the admin user may assign the agents whose calls the restricted user may have access to. All the agents that may be assigned will appear in the column as illustrated by A. The admin user clicks the agent’s name they would like to assign the restricted. Doing so will result in the agent appearing in column B. An admin user may also search for an agent they may wish to assign by entering the agent’s name in the search field as illustrated by C. To remove an agent associated with a restricted user, the admin user would click on the agent’s name in column B. Once the admin user has assigned all the individual agents to the restricted user, they must save the selection by clicking the Save button illustrated by D. See Agent Management Page for more information regarding agents. - The Assign Group
 icon permits the admin user to restrict the agents whose calls the restricted user may have access by agent group(s). Clicking this icon will result is an Edit Assigned Groups dialog appearing which will look similar to the following;

In the dialog the admin user may assign the agent groups whose calls the restricted user may have access to. All the groups that may be assigned will appear in the column as illustrated by A. The admin user clicks the agent group they would like to assign the restricted user by clicking on the group’s name. Doing so will result in the group appearing in column B. An admin user may also search for a group they may wish to assign by entering the group’s name in the search field as illustrated by C. To remove a group associated with a restricted user, the admin user would click on the agent group in column B. Once the user has assigned all the agent groups to the restricted user, they must save the selection by clicking the Save button illustrated by D. See Agent Groups Page for more information. - The Assign Site icon permits the admin user to restrict a user by site(s). Clicking this icon will result is an Edit Assigned Sites dialog appearing which will look similar to the following;

In the dialog the admin user may assign the sites whose calls the restricted user may have access to. All the sites that may be assigned will appear in the column as illustrated by A. The admin user clicks the site they would like to assign the restricted user by clicking on the site’s name. Doing so will result in the site appearing in column B. An admin user may also search for a site they may wish to assign by entering the site’s name in the search field as illustrated by C. To remove a site associated with a restricted user, the admin user would click on the sites name in column B. Once the admin user has assigned all the sites to the restricted user, they must save the selection by clicking the Save button illustrated by D. See Site Management Page for more information - Clicking on Edit Columns allow the logged in user to change the columns the user would like to be visible. An example of the dialog that appears is;

Each column in the data table can be sorted by clicking on the column name and filtering can be applied by clicking on the icon adjacent to the column heading which appears as the user passes their cursor over the column’s name the user is wanting to apply the filter. In the associated dialog that appears, the user will enter the criteria that are to be applied to the filter to produce the desired result. - Clicking the circumflex associated with the agent will provide a summary of any agents, agent groups or sites that have been assigned the user
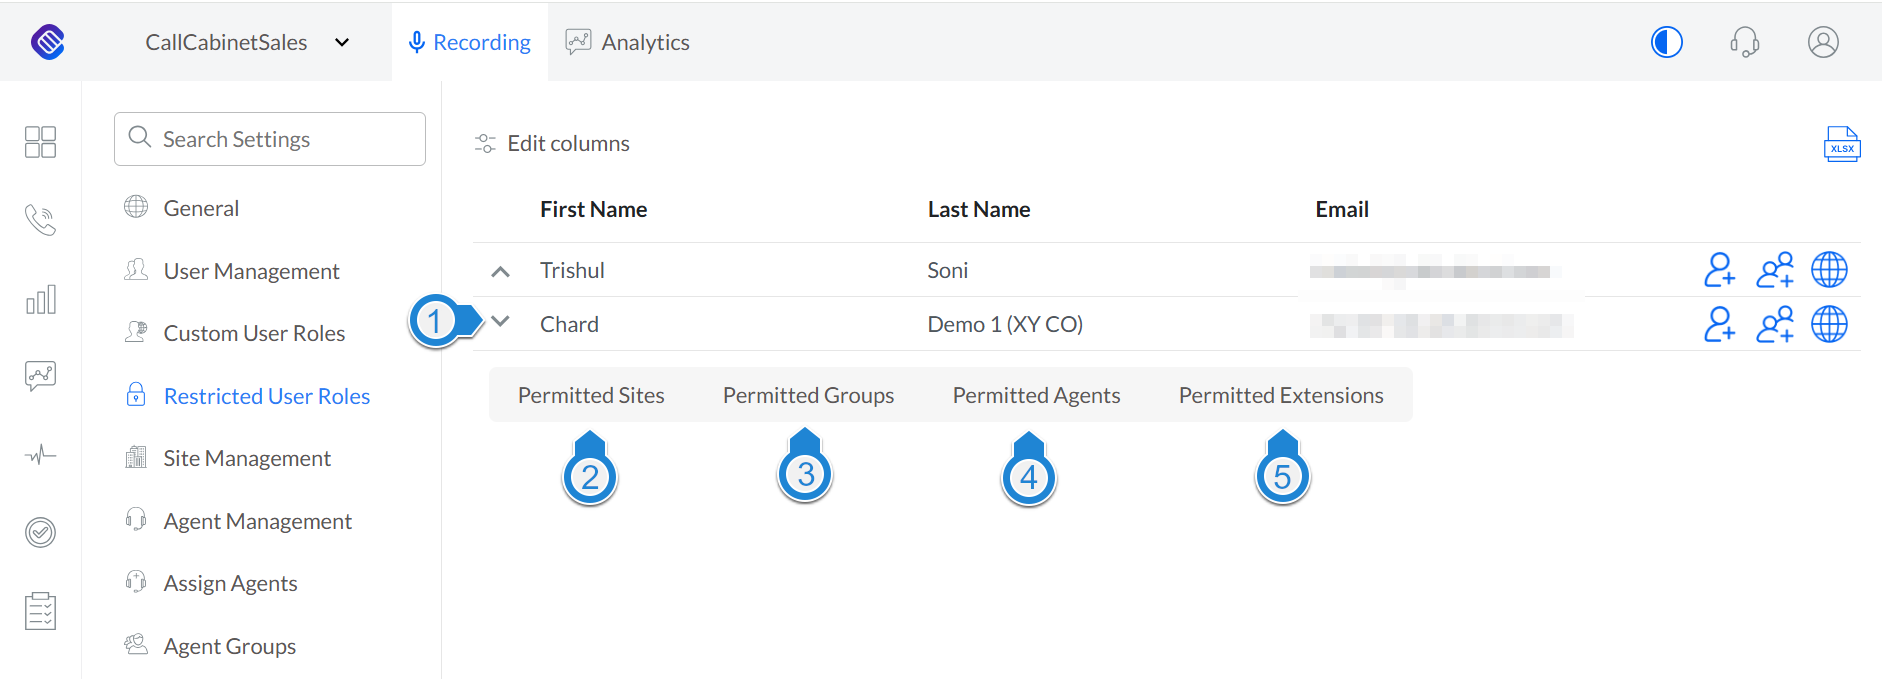
Figure – Restricted User Agent Summary
To discuss this a little further, the numbers below refer to Figure – Restricted User Agent Summary.
- The admin user clicks this circumflex associated with a restricted user, revealing an ‘agent permission’ card.
- Clicking this tab reveals a table displaying all the sites assigned to this restricted user. For example;

- Clicking this tab reveals a table displaying all the groups assigned to this restricted user. For example;

- Clicking this tab reveals a table displaying all the agents assigned to this restricted user. For example;

- Clicking this tab reveals a table displaying all the extensions assigned to this restricted user. For example;

Site Management
The Site Management page allows a user to edit and delete sites.
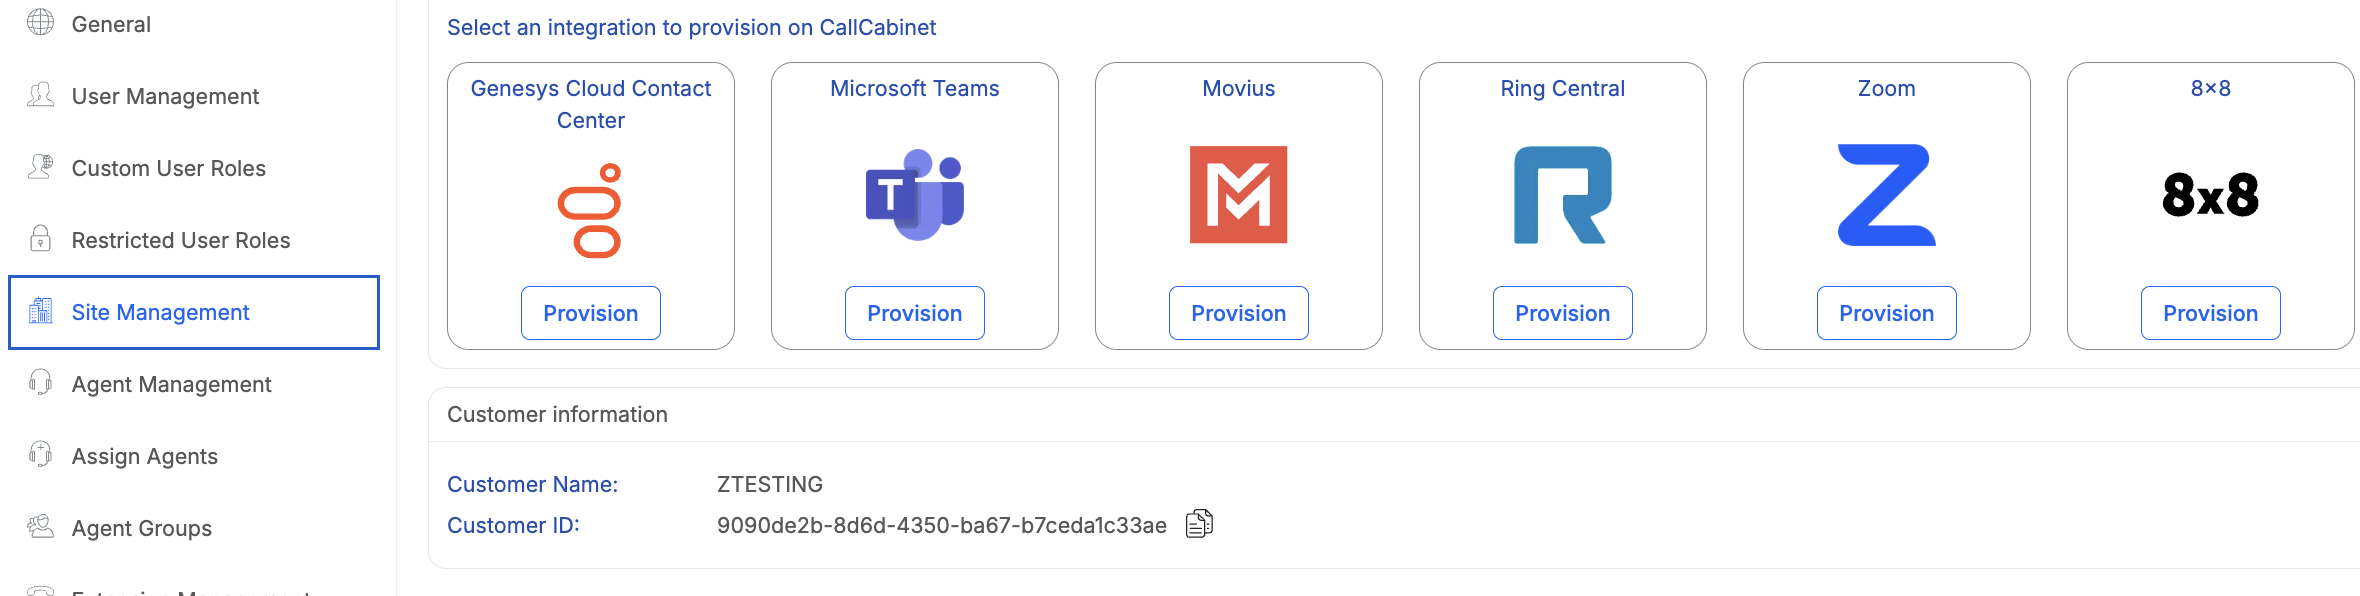
The numbers in the discussion below relate to the image in Figure Site Management.
- The Customer Information section displays Customer Name and Customer ID, which are unique to the customer
- Clicking on the Provision button on any of the third-party applications the user would like to provision will direct the user to an instruction page for that application.
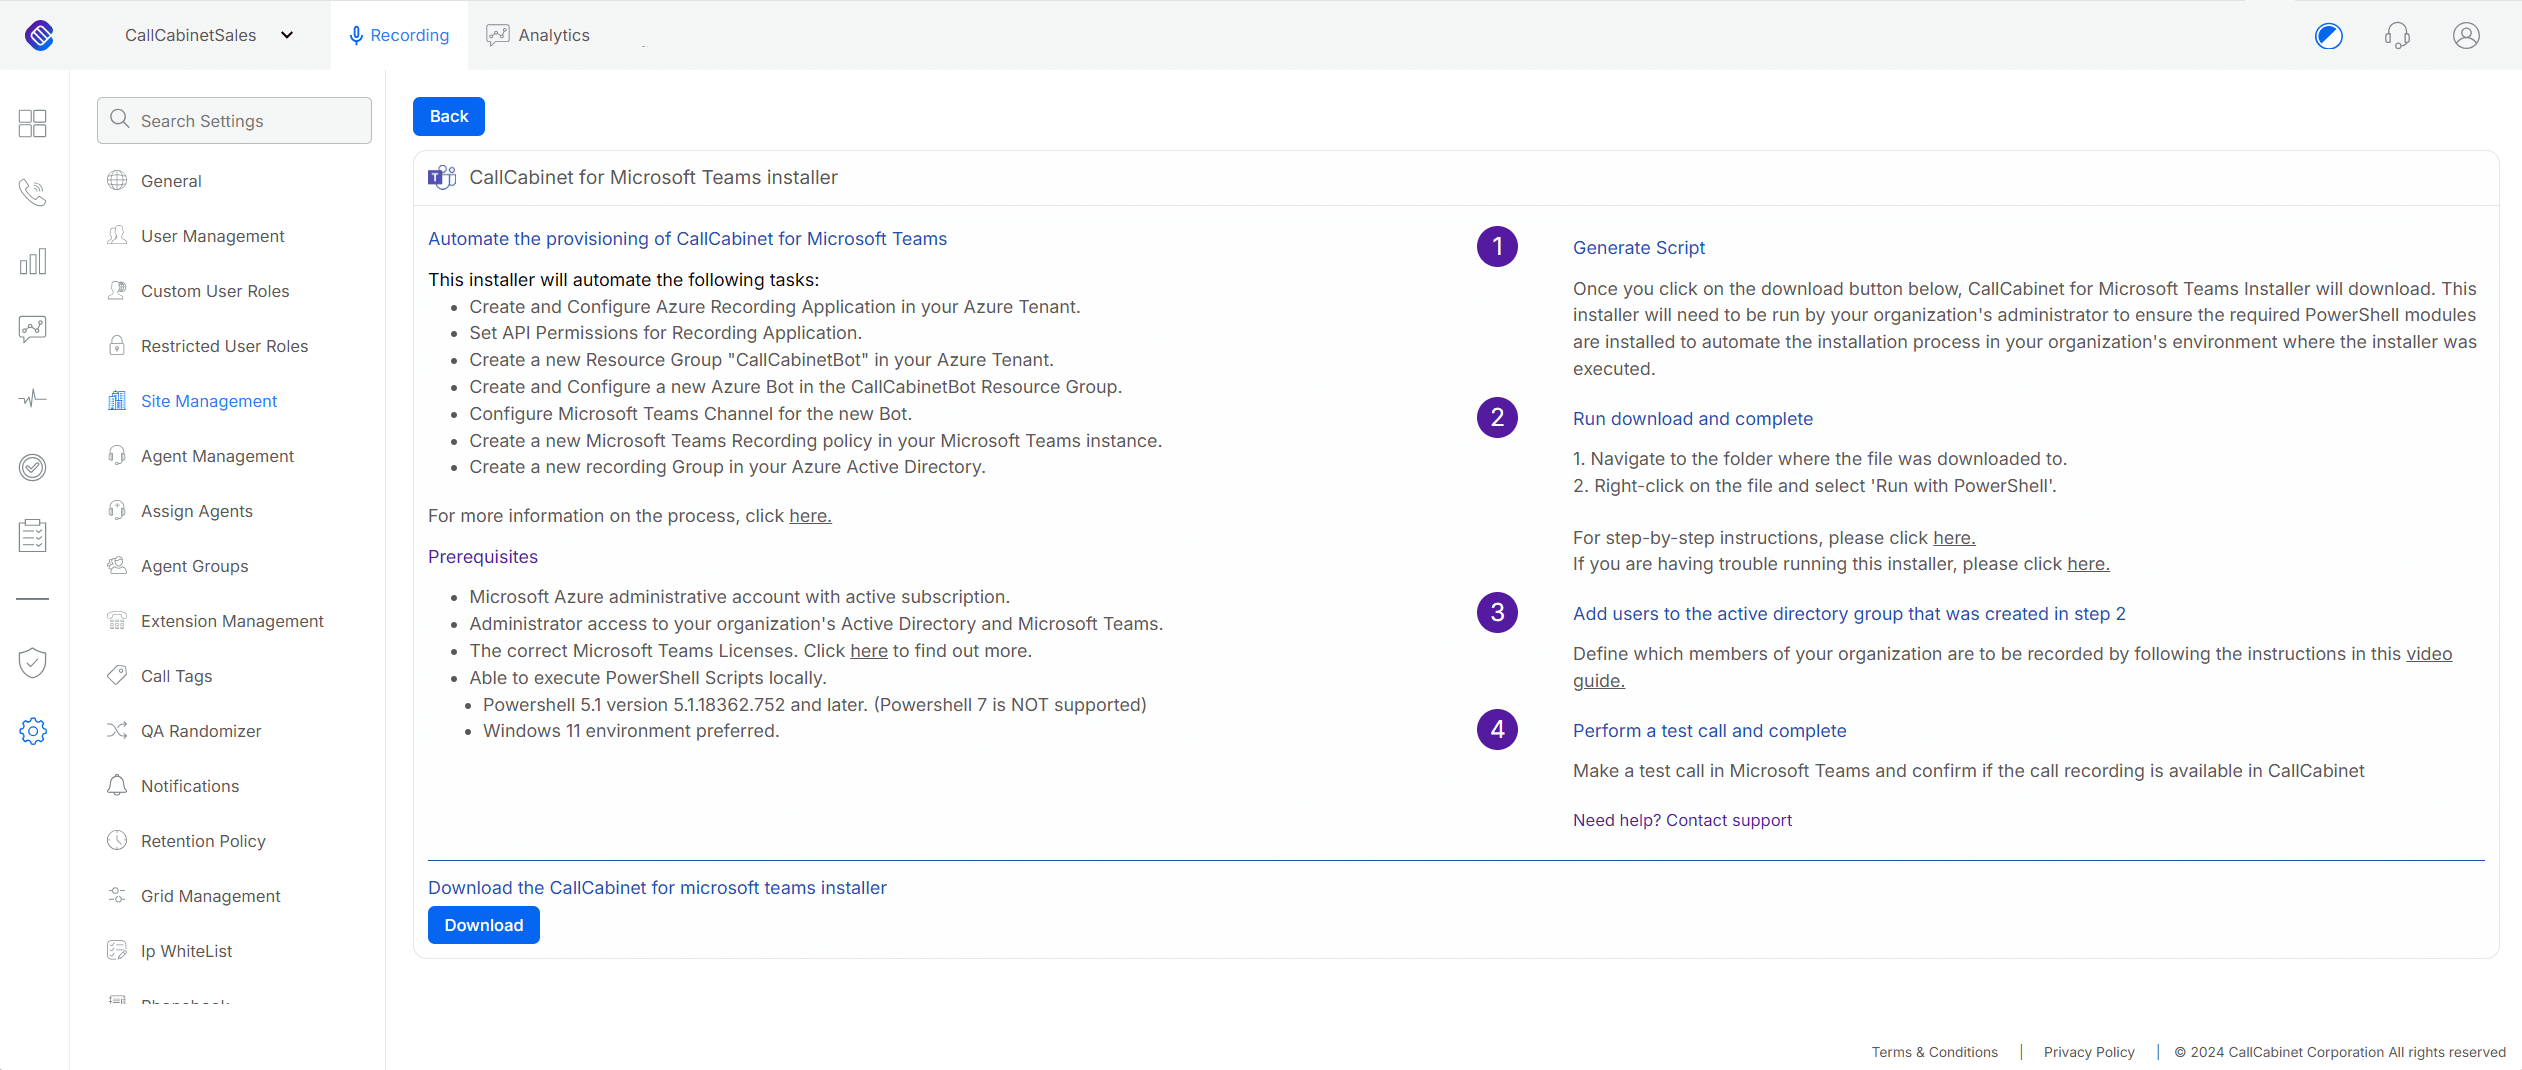
Figure – Provisioning Microsoft Teams
For instance, if the user clicked on the Provision button for Microsoft Teams button will direct the user to the CallCabinet for Microsoft Teams Installer. The user will then download the installer and follow the prompts to provision CallCabinet for Microsoft Teams. The page the user is directed to is illustrated in Figure – Provisioning Microsoft Teams and which outlines the prerequisites for provisioning the Microsoft Teams Installer.
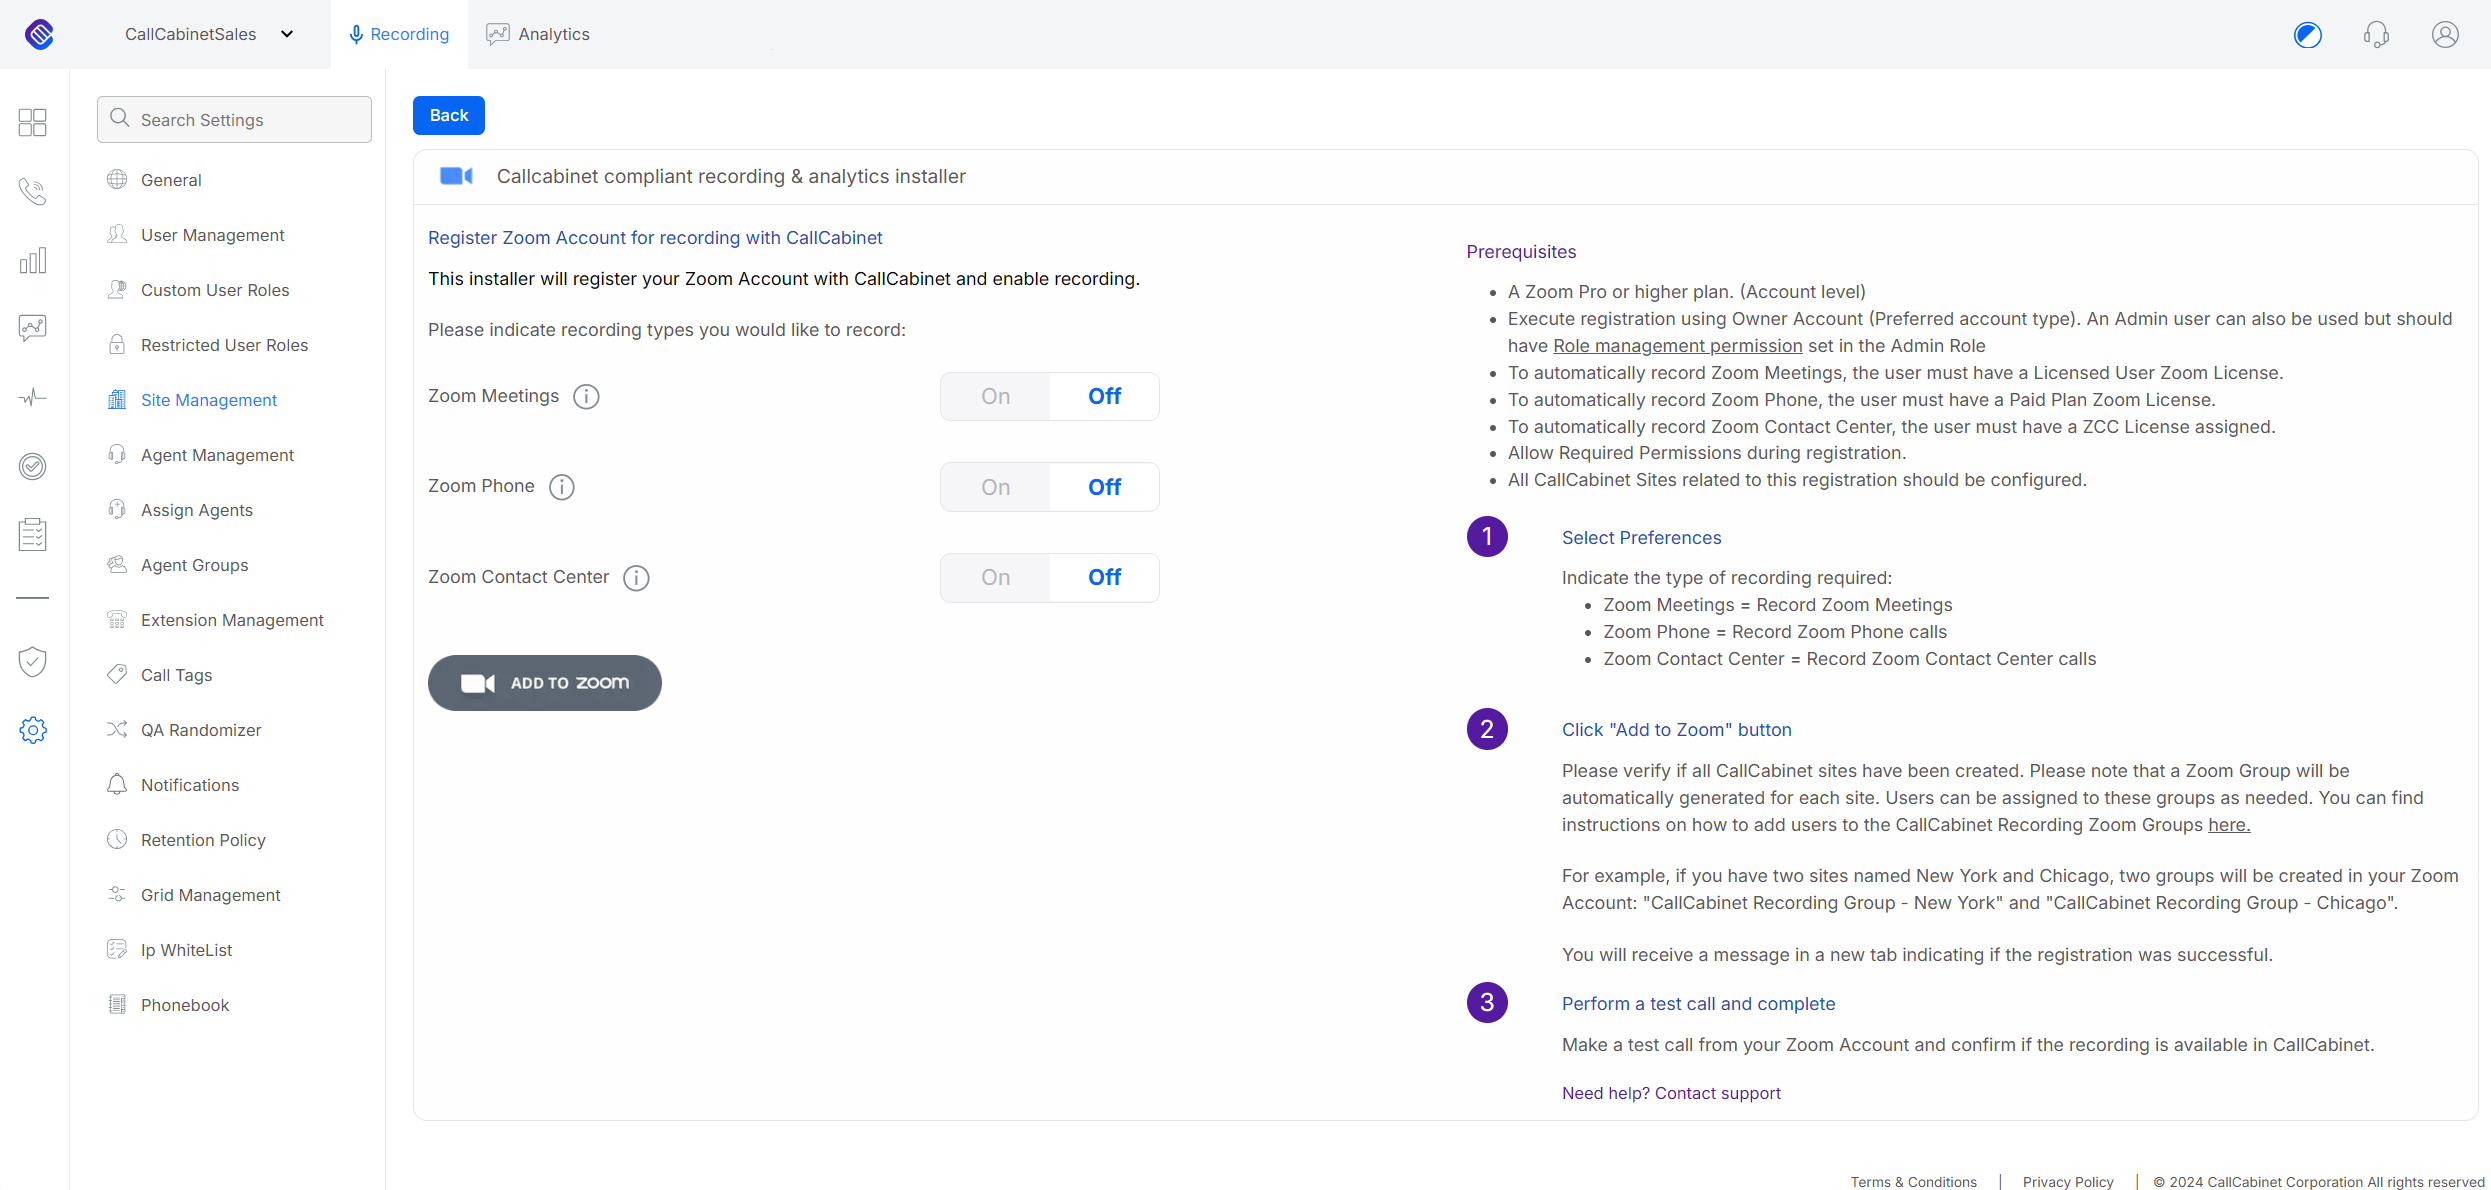
Figure – Provisioning Zoom
Clicking the Provision button for Zoom will direct the user to the CallCabinet for Zoom Installer, which is illustrated in Figure – Provisioning Zoom. The user will download the installer and follow the prompts to provision CallCabinet for Zoom.
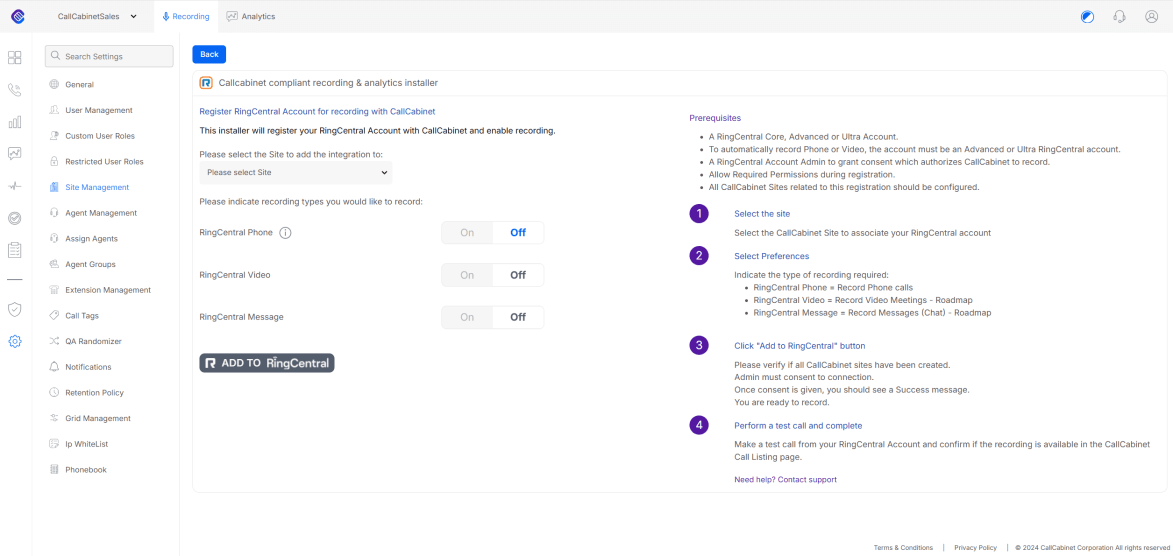
Figure – Provisioning RingCentral
As a final example; Clicking the Provision button for RingCentral will direct the user to the CallCabinet for RingCentral’s Installer. The user will then download the installer and follow the prompts to provision CallCabinet for RingCentral. The page the user is directed to is illustrated in Figure – Provisioning RingCentral and which outlines the prerequisites for provisioning the RingCentral Installer.
Clicking Provision corresponding to Movius, the Movius Compliant Recording Registration page is displayed. On this page, you must enter the following details:
- Site Name: Select the site name.
- SFTP Host: Enter the host name.
- SFTP Username: Enter the SFTP username.
Once all the information is entered, click Register Movius. The Site Registration is complete message is displayed.
If the entered details are incorrect, the following error is displayed:
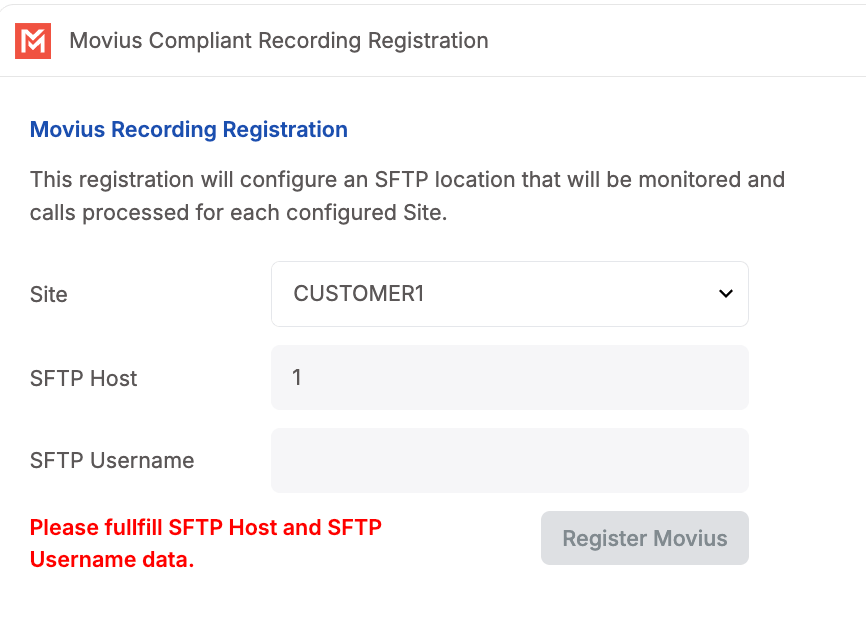
When you click Provision corresponding to Genesys Cloud Center, the Genesys Compliant Recording Registration page is displayed. On this page, enter the following details:
- Please select the Site to add the integration to: From this drop-down list, select the site name.
- Desktop Screen Recording: Enable this option to allow desktop screen recording along with voice recordings.
- Choose a Genesys Region: From this drop-down list, select the Genesys Cloud region
where your organization is hosted (for example, US-East, EU-West, APAC).
Once all the information is filled, click Add to Genesys Cloud.
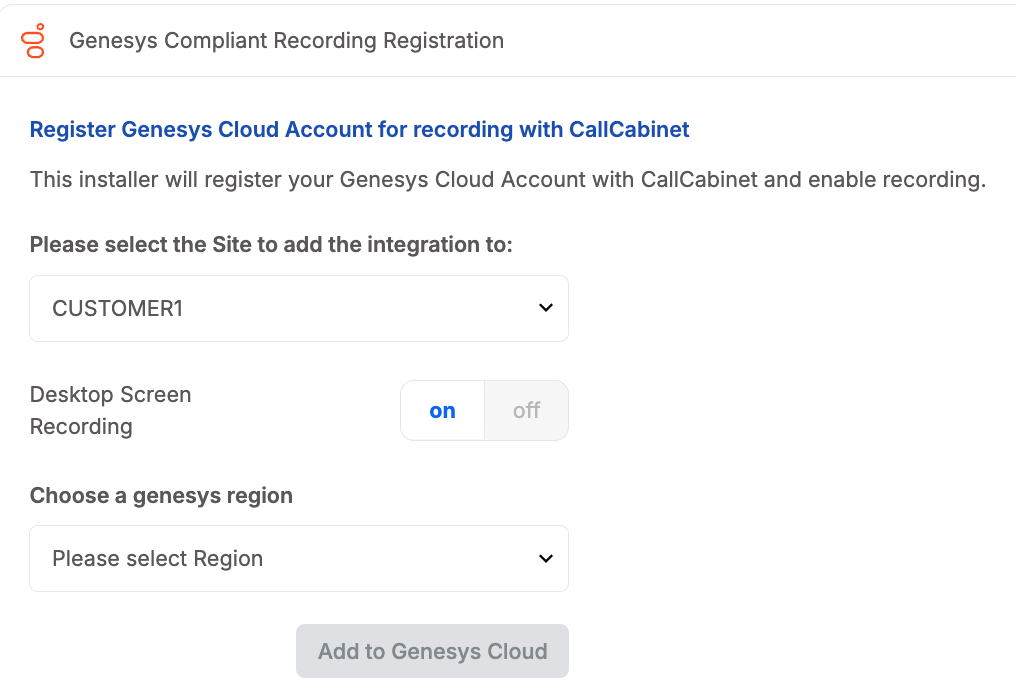
- The Data Table details a list of your current sites, including the unique site ID, site name, the default compliance interval and the hide unanalyzed calls feature for each site.
- By checking the Hide Unanalyzed Call checkbox will result in the fact that only once a call has been fully analyzed will it appear in the Call Listing page. Until that time, it will remain invisible. By leaving the checkbox unchecked will result in the call being visible in the Call Listing page, even if it has not been fully analyzed by CallCabinet.
- The Edit Pencil
 icon permits the user to edit the associated site.
 - The Trash
 icon permits the user to delete the associated site.
 - Clicking on Edit Columns allow the logged in user to change the columns the user would like to be visible. Each column in the data table can be sorted by clicking on the column name and filtering can be applied by clicking on the ‘filter icon’ adjacent to the column heading the user is wanting to apply the filter.
- Clicking this button will allow an admin user to create a new site. To add a new site, the user is required to enter the required information. The discussion below regarding the various fields relates to Figure – Add New Site.
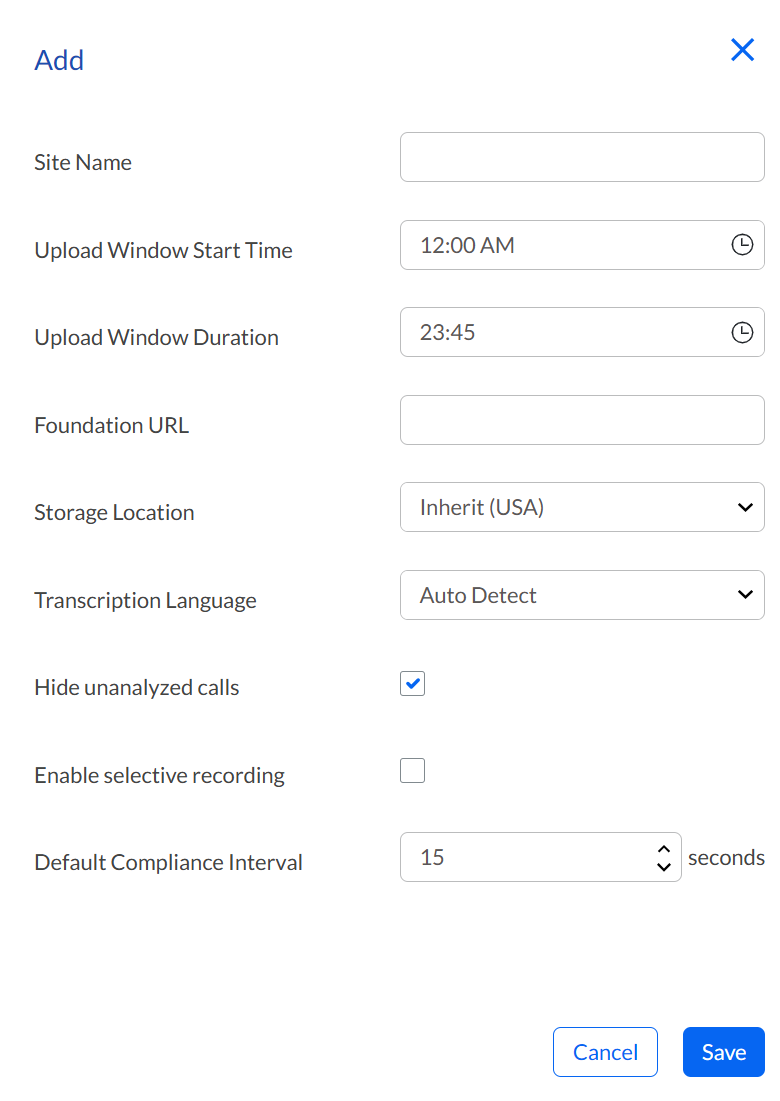
Figure – Add New Site
- Site Name is the name you would like to give the site.
- The Upload Window Start Time and Upload Window Duration fields relate to the site-specific time period selected, defining when calls may be uploaded to CallCabinet. By default, the duration is set to zero, which means calls will upload as soon as they are processed.
- The Foundation URL field permits the user to enter a URL specific to an onsite recorder for CallCabinet’s Foundation users with a hybrid solution (on-prem and cloud storage).
- Storage Location is where the calls associated with this site are to be stored. The admin user should select the location that is closest to them.
- Transcription Language allows the admin user to select what transcription language should be by clicking the dropdown list and selecting the appropriate language. By default, CallCabinet attempts to auto detect the language being spoken and then transcribes for that language.
- Hide Unanalyzed Calls allows the admin user to determine whether a call should be listed if it has or has not been analyzed. By default, a call will not appear in the Call Listing page until such time all analysis on that call has been completed. This includes PIC redaction. Should a user want their calls on this site to be displayed even though analysis is not completed, then this feature should be unchecked. It is highly recommended that this remains checked
- The Enable Selective Recording enables users to select from the following settings:
a) enable recording of all currently configured extensions,
b) disable all recording for currently configured extensions and
c) manually choose which currently configured extensions to record.Checking this checkbox will result in a confirmation dialog appearing that the user needs to agree to in order for selective recording to be enabled. An example of this confirmation dialog is shown in Figure – Enable Selective Recording Confirmation. - The Default Compliance Interval for the CallCabinet Agent Client Desktop application is set per site and is managed here.
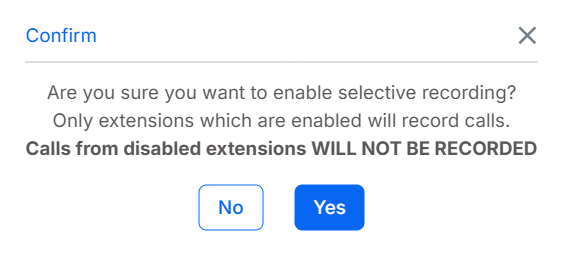
Figure – Enable Selective Recording Confirmation
Agent Management
NOTE: Agents are individuals whose calls are being recorded by CallCabinet.
The Agent Management page permits a user to create, bulk import, edit and delete agents as required.
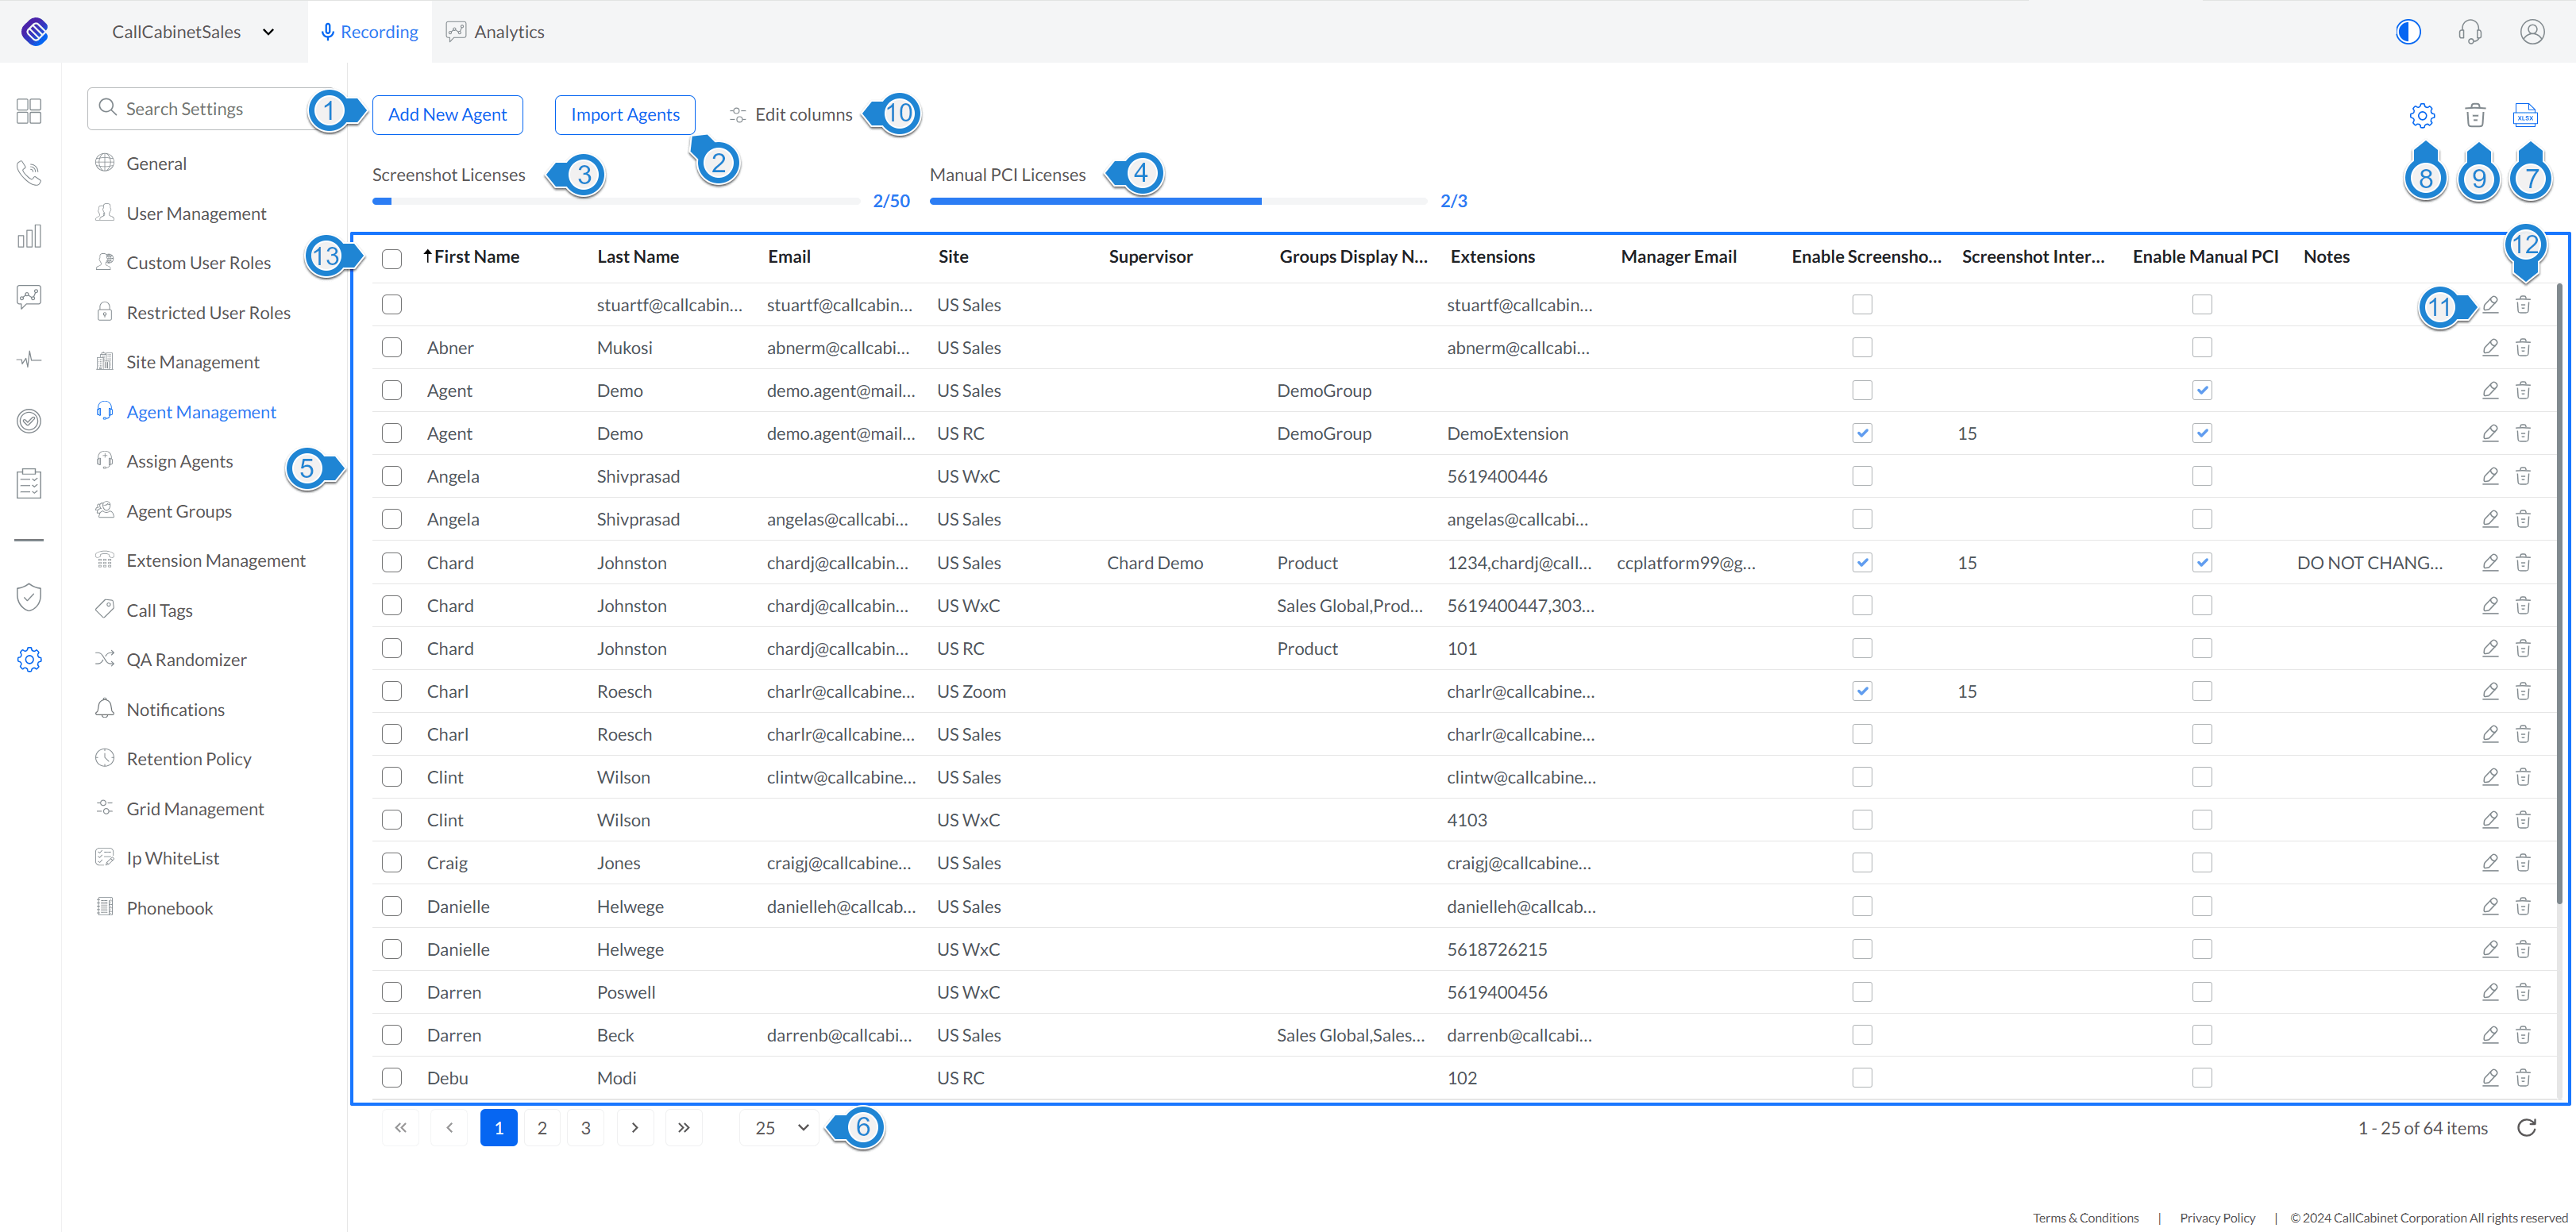
Figure- Agent Management
The numbers in the discussion below relate to the image in Figure Agent Management:
- Clicking on the Add New Agent button opens a dialog, which is illustrated and described in Figure Add New Agent.
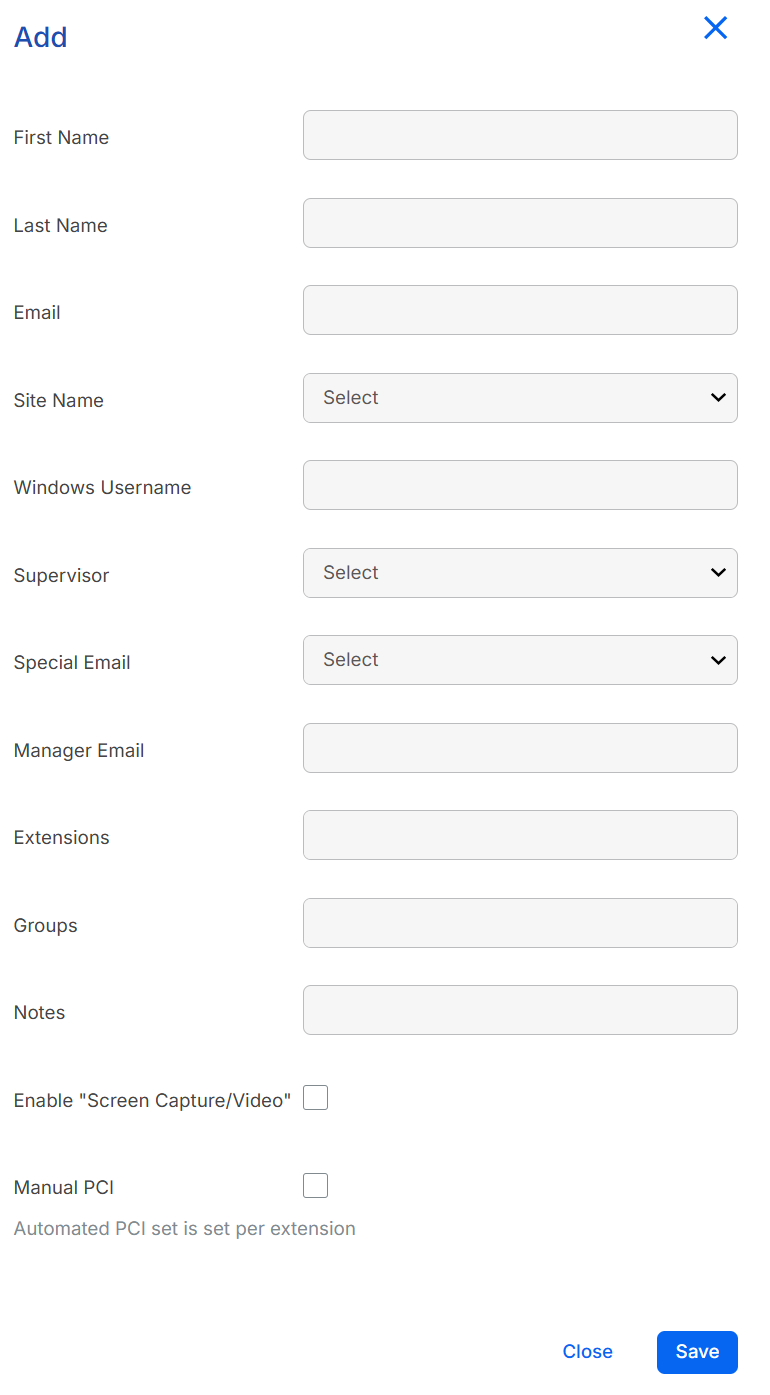
Figure – Add New Agent
To add a new agent, the logged in user is required to enter information into the various fields as described below. This discussion relates to the image found in Figure Add New Agent
- The administrator enters the required agent information such as the agent’s First Name, Last Name, and Email address
- The administrator should select the appropriate Site Name from the site name drop-down list.
- The administrator should enter the agent’s Windows Username which is to identify the windows user to whom the CallCabinet Agent Client application will be assigned.
- The administrator should then select the agent’s Supervisor, Special Email, Extensions, Groups and any Notes that may be of use.
- Checking the Enable “Screen Capture/Video” check box will enable screenshots on this agent’s profile using the CallCabinet Agent Client. Once checked, the user will need to set the interval between screenshots. CallCabinet recommendation is 15-second intervals. Please note that a license is required for the use of this feature.
- Checking the Manual PCI check box will enable manual compliance intervention using the CallCabinet Agent Client. Please note that automatic PCI is enabled on an extension. If Manual PCI is enabled then the extension that is associated with this agent must have its ‘Redaction Automated’ checkbox disabled. Please note that a manual PCI license is required for this feature.
NOTE: if automated PCI redaction is required, the administrator does not enable it here under Agent Management, but rather under the extension management where this feature is enabled on the extension that is associated with this agent.
- Clicking on the Import Agents button opens a dialog which permits the user to download a template, complete the required fields and upload the template to perform a bulk import of agent information. An example of the Import Agents dialog is:

- The agent license display area displays how many Screenshot Licenses are currently in use and available (purchased). For more information, please refer to Table 1 – Agent Licenses.
- The agent license display area displays how many Manual PCI Licenses are currently in use and available (purchased). For more information, please refer to Table 1 – Agent Licenses.
- The Agent Data Table displays all the account’s agent information. Details such as the agent’s first name, last name, site, assigned agent groups, whether screenshot capture is enabled and whether manual PCI redaction has been enabled are rendered.
- The Items per-page drop-down allows a user to change the number of items returned on each page. The range is from 25 – 10 000.
- The Excel icon, when clicked, will export the Agent Data Table in an xlsx file directly to the user’s desktop.
- Clicking on the Cog
 icon results in a Reassign Calls dialog appearing in which the user may bulk re-assign extensions to agents using a defined date range. An example of the Reassign Calls dialog rendered is:
- The Trash icon will delete one or more agents depending on how many you select using the bulk selector check box in the far left-hand column (indicator 13).
- Clicking on Edit Columns allow the logged in user to change the columns the user would like to be visible.
- The Edit Pencil icon permits the user to edit the associated site.
- The Trash icon permits the user to delete the associated site.
- The Bulk check(tick) box; By checking this box, all the agents are selected that appear in the Agent Data Table. Should a user want to select individual agents, then the user would check each agent’s individual checkbox associated on each line.
Each column in the data table can be sorted by clicking on the column name and filtering can be applied by clicking on the icon ![]() adjacent to the column heading which appears as the user passes their cursor over the column’s name the user is wanting to apply the filter. In the associated dialog that appears, the user will enter the criteria that are to be applied to the filter to produce the desired result.
adjacent to the column heading which appears as the user passes their cursor over the column’s name the user is wanting to apply the filter. In the associated dialog that appears, the user will enter the criteria that are to be applied to the filter to produce the desired result.
| Recording License | Refers to an agent recording license per targeted extension. |
| Screen Capture Licenses | Refers to CallCabinet’s Agent Client Desktop Application which can take screenshots of the agent’s desktop at intervals the user specifies, whilst the agent is on an active call. |
| Manual PCI DSS Redaction | Refers to CallCabinet’s Agent Client Desktop Application in which agents can: Begin a compliance interval, make a note, add a reference or manage email address settings. |
| Automatic PCI DSS Redaction | Refers to CallCabinet’s Analytics licensing that utilizes Speech-to-text transcription which may be set to automatically redact personal and private information from the audio and transcription. |
| Speech-to-text -transcription | Refers to CallCabinet’s Speech-to-Text transcription tool through CallCabinet’s Analytics Licensing. |
Table 1 – Agent Licenses
Assign Agents
The Assign Agents page grants the admin user permission to assign agents to extensions. Each agent may be assigned an extension. The numbers in the discussion below relate to the image in Figure Assign Agents:
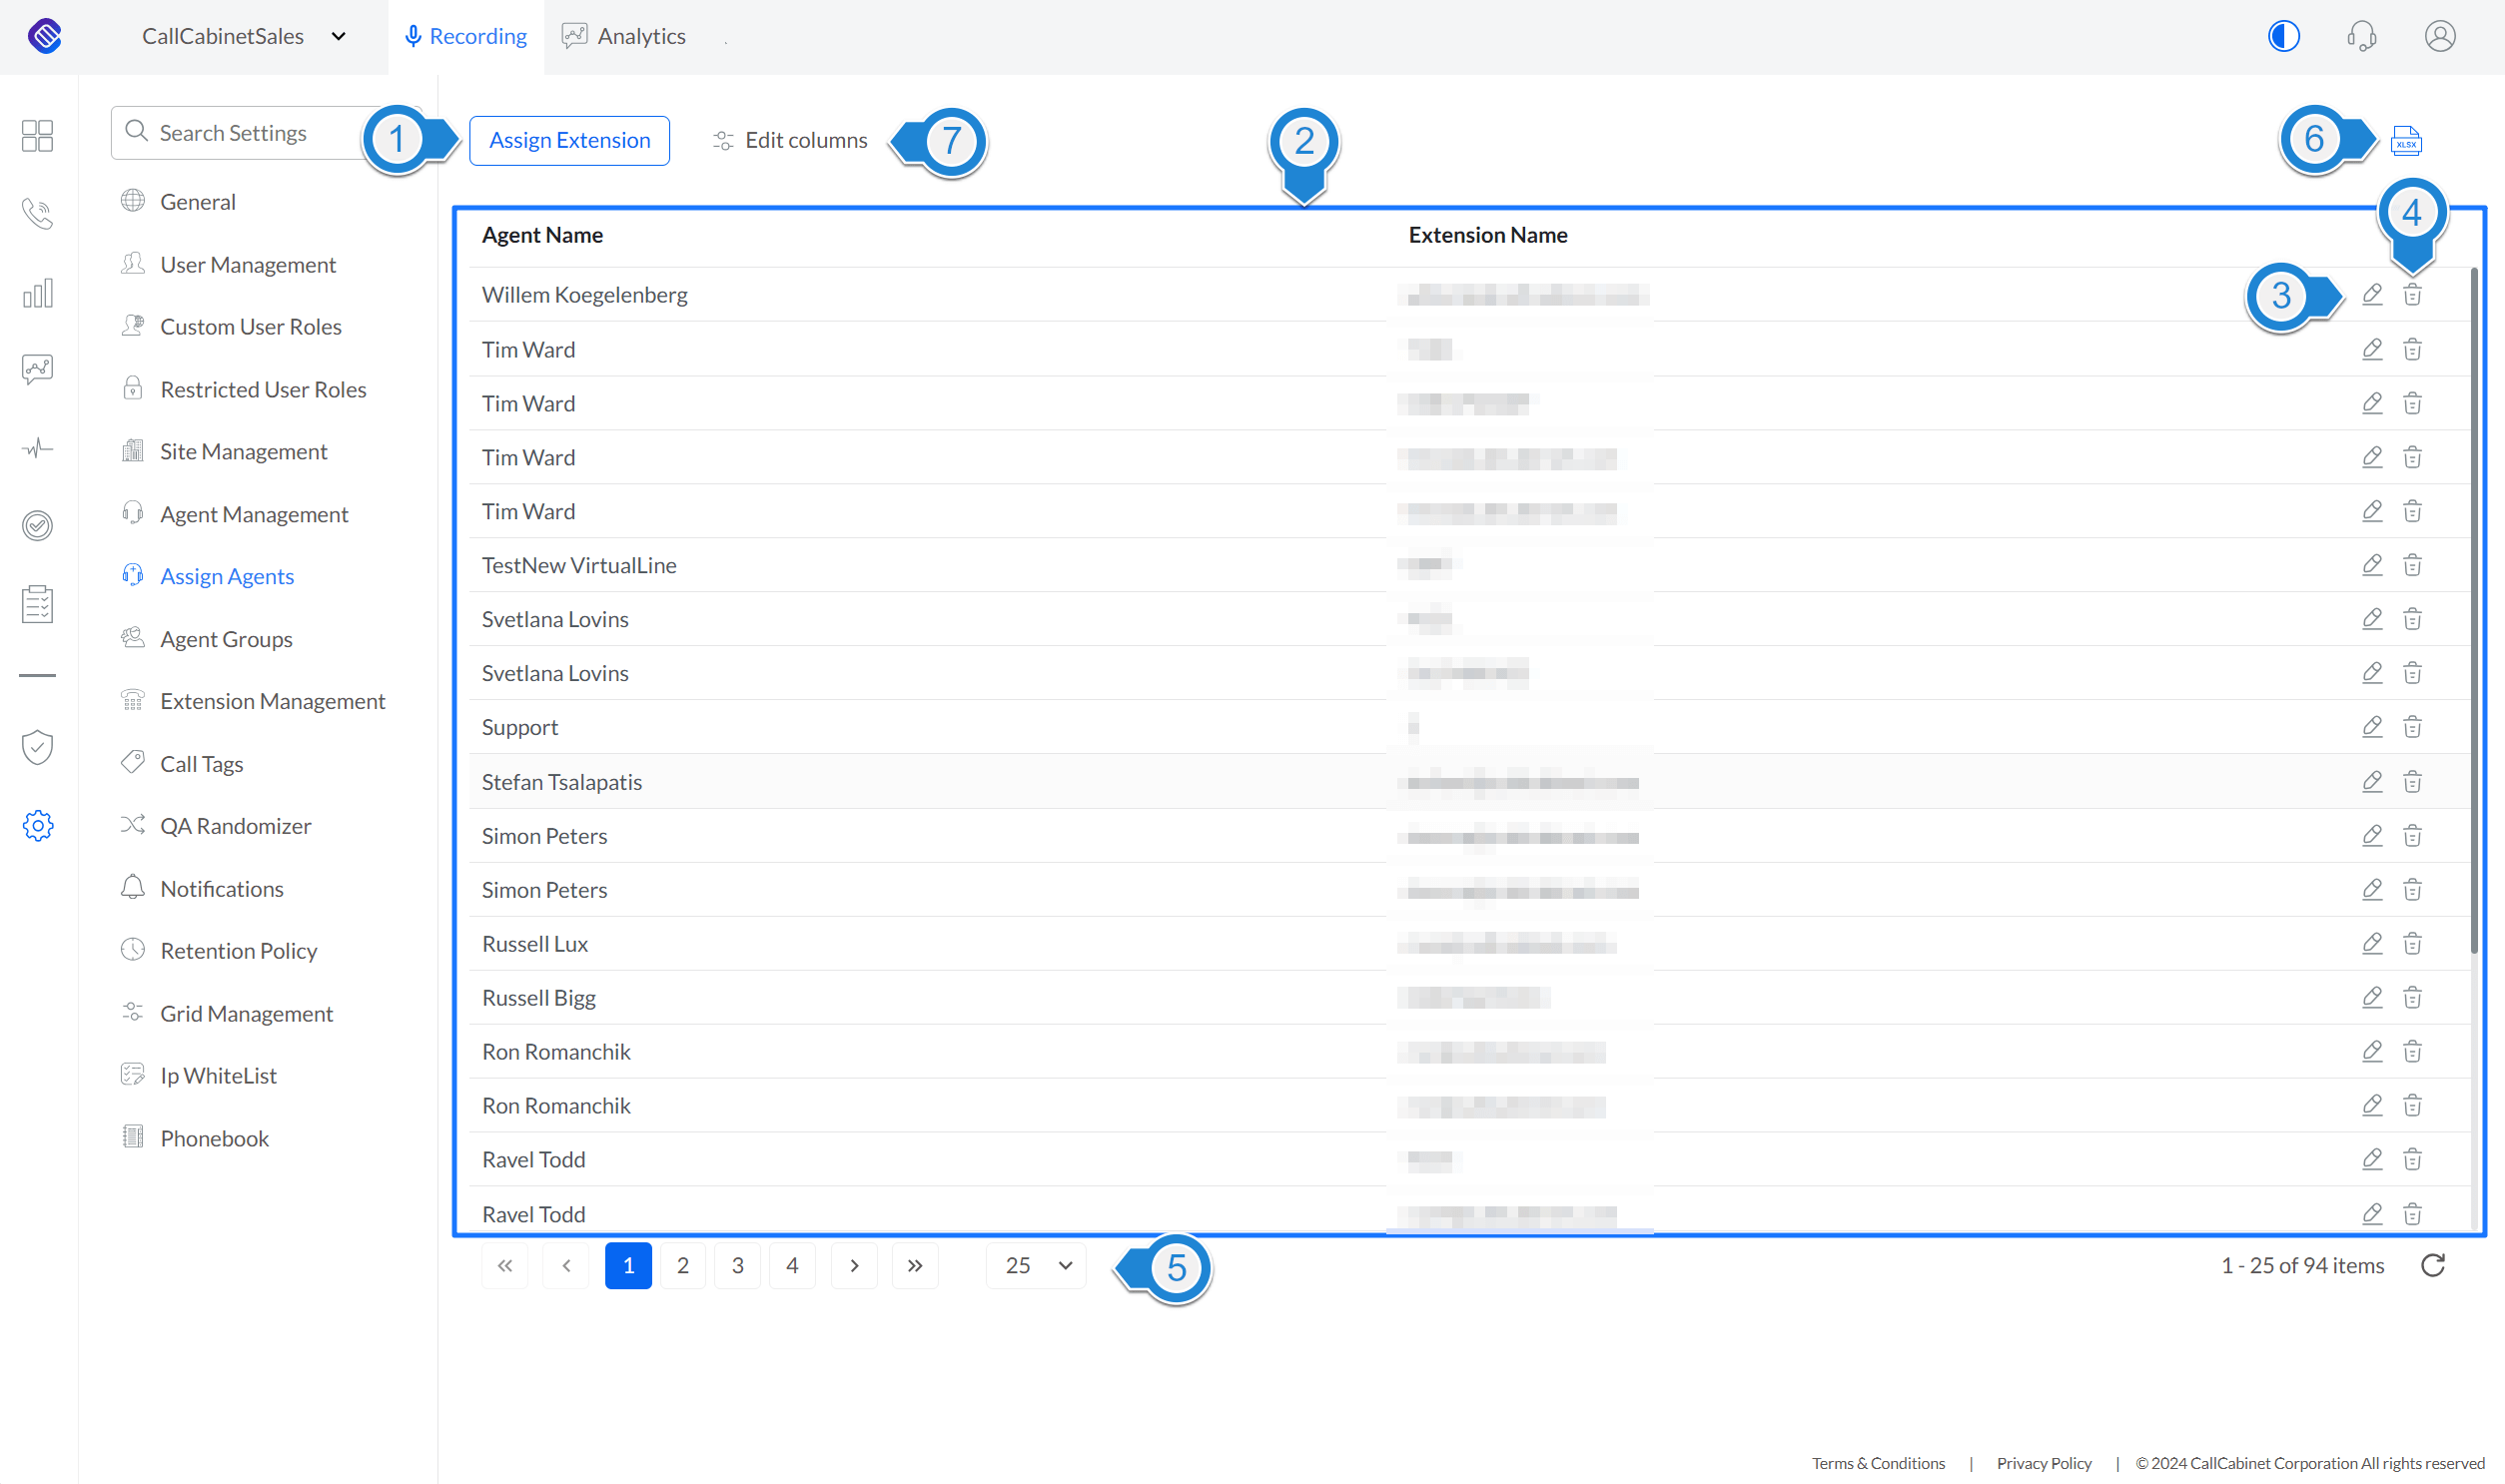
Figure – Assigning Agents
- Clicking on the Assign Extension button will open a dialog box allowing the user to associate an agent with an extension by choosing an agent and an extension from drop-down menus. An example of this dialog is illustrated below.
 Agents can be created by clicking on the Settings > Agent Management menu item. Extensions can be created by clicking on the Settings > Extension Management menu item.
- The Assign Agents Table displays an agent list and their associated extensions.
- The Edit Pencil icon permits the user to edit assigned extensions and agents.
- The Trash icon permits the user to delete the associated agent and extension information.
- The Items per-page drop-down allows a user to change the number of agents and associated extensions returned on each page. The range is from 25 to 2000.
- The Excel icon, when clicked, will export the Assign Agents Table in an xlsx file directly to the user’s desktop.
- Clicking on Edit Columns allow the logged in user to change the columns the user would like to be visible in the Assign Agents Table. An example of this dialog is;

Each column in the data table can be sorted by clicking on the column name and filtering can be applied by clicking on the icon ![]() adjacent to the column heading which appears as the user passes their cursor over the column’s name the user is wanting to apply the filter. In the associated dialog that appears, the user will enter the criteria that are to be applied to the filter to produce the desired result.
adjacent to the column heading which appears as the user passes their cursor over the column’s name the user is wanting to apply the filter. In the associated dialog that appears, the user will enter the criteria that are to be applied to the filter to produce the desired result.
Agent Groups
The Agent Groups page permits the admin user to create one or more groups to which agents may be assigned.
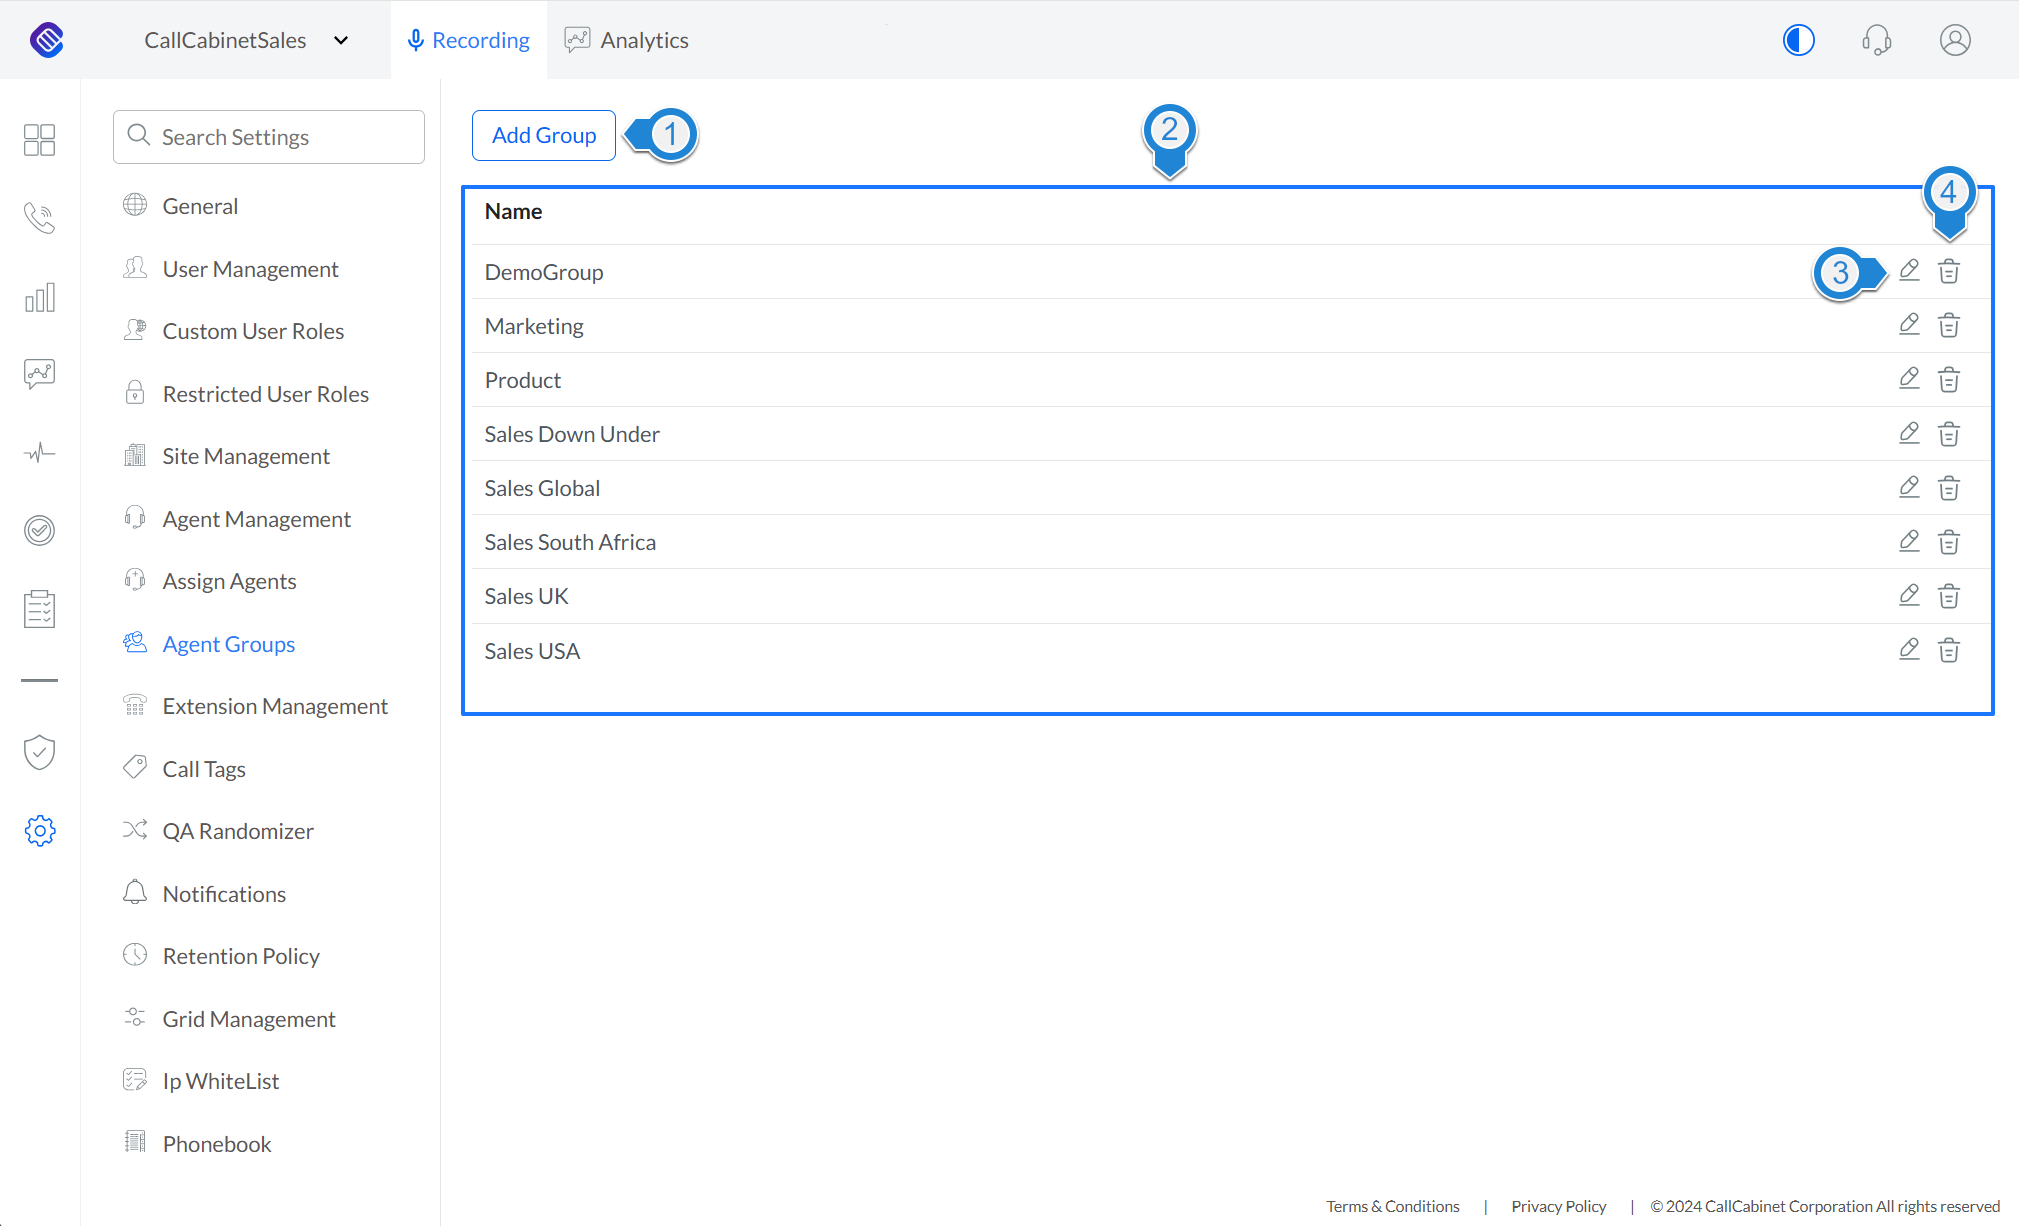
Figure – Agent Groups
For example, a company may want to group agents into a specific department, for instance a finance department. The user may then create the group, call it financeDepartment, and assign agents to it, thereby linking them to the financeDepartment group and all functions associated with it. This group then becomes useful, for instance, in the Call Listing page where a user might decide to filter calls associated with a particular department. The user may decide that the department is the finance department and then select the group financeDepartment as the filter. Performing a search against this filter will result in a list of all calls and participating agents being returned and displayed for this group only. Groups are useful for report generation too.
The numbers in the discussion below relate to the image in Figure Agent Groups:
- The Add Group button will open a dialog box, in which the user may enter the name they would like to assign the group and which agents should be assigned to that group. An example of this dialog is illustrated below:
- The Group Data Table displays a group list of all the groups created.
- The Edit Pencil icon permits the user to edit the associated group and the agents assigned to that group.
- The Trash icon permits the user to delete the associated group.
Each column in the data table can be sorted by clicking on the column name and filtering can be applied by clicking on the icon ![]() adjacent to the column heading which appears as the user passes their cursor over the column’s name the user is wanting to apply the filter. In the associated dialog that appears, the user will enter the criteria that are to be applied to the filter to produce the desired result.
adjacent to the column heading which appears as the user passes their cursor over the column’s name the user is wanting to apply the filter. In the associated dialog that appears, the user will enter the criteria that are to be applied to the filter to produce the desired result.
Extension Management
The Extension Management page allows the admin user to manage extensions.
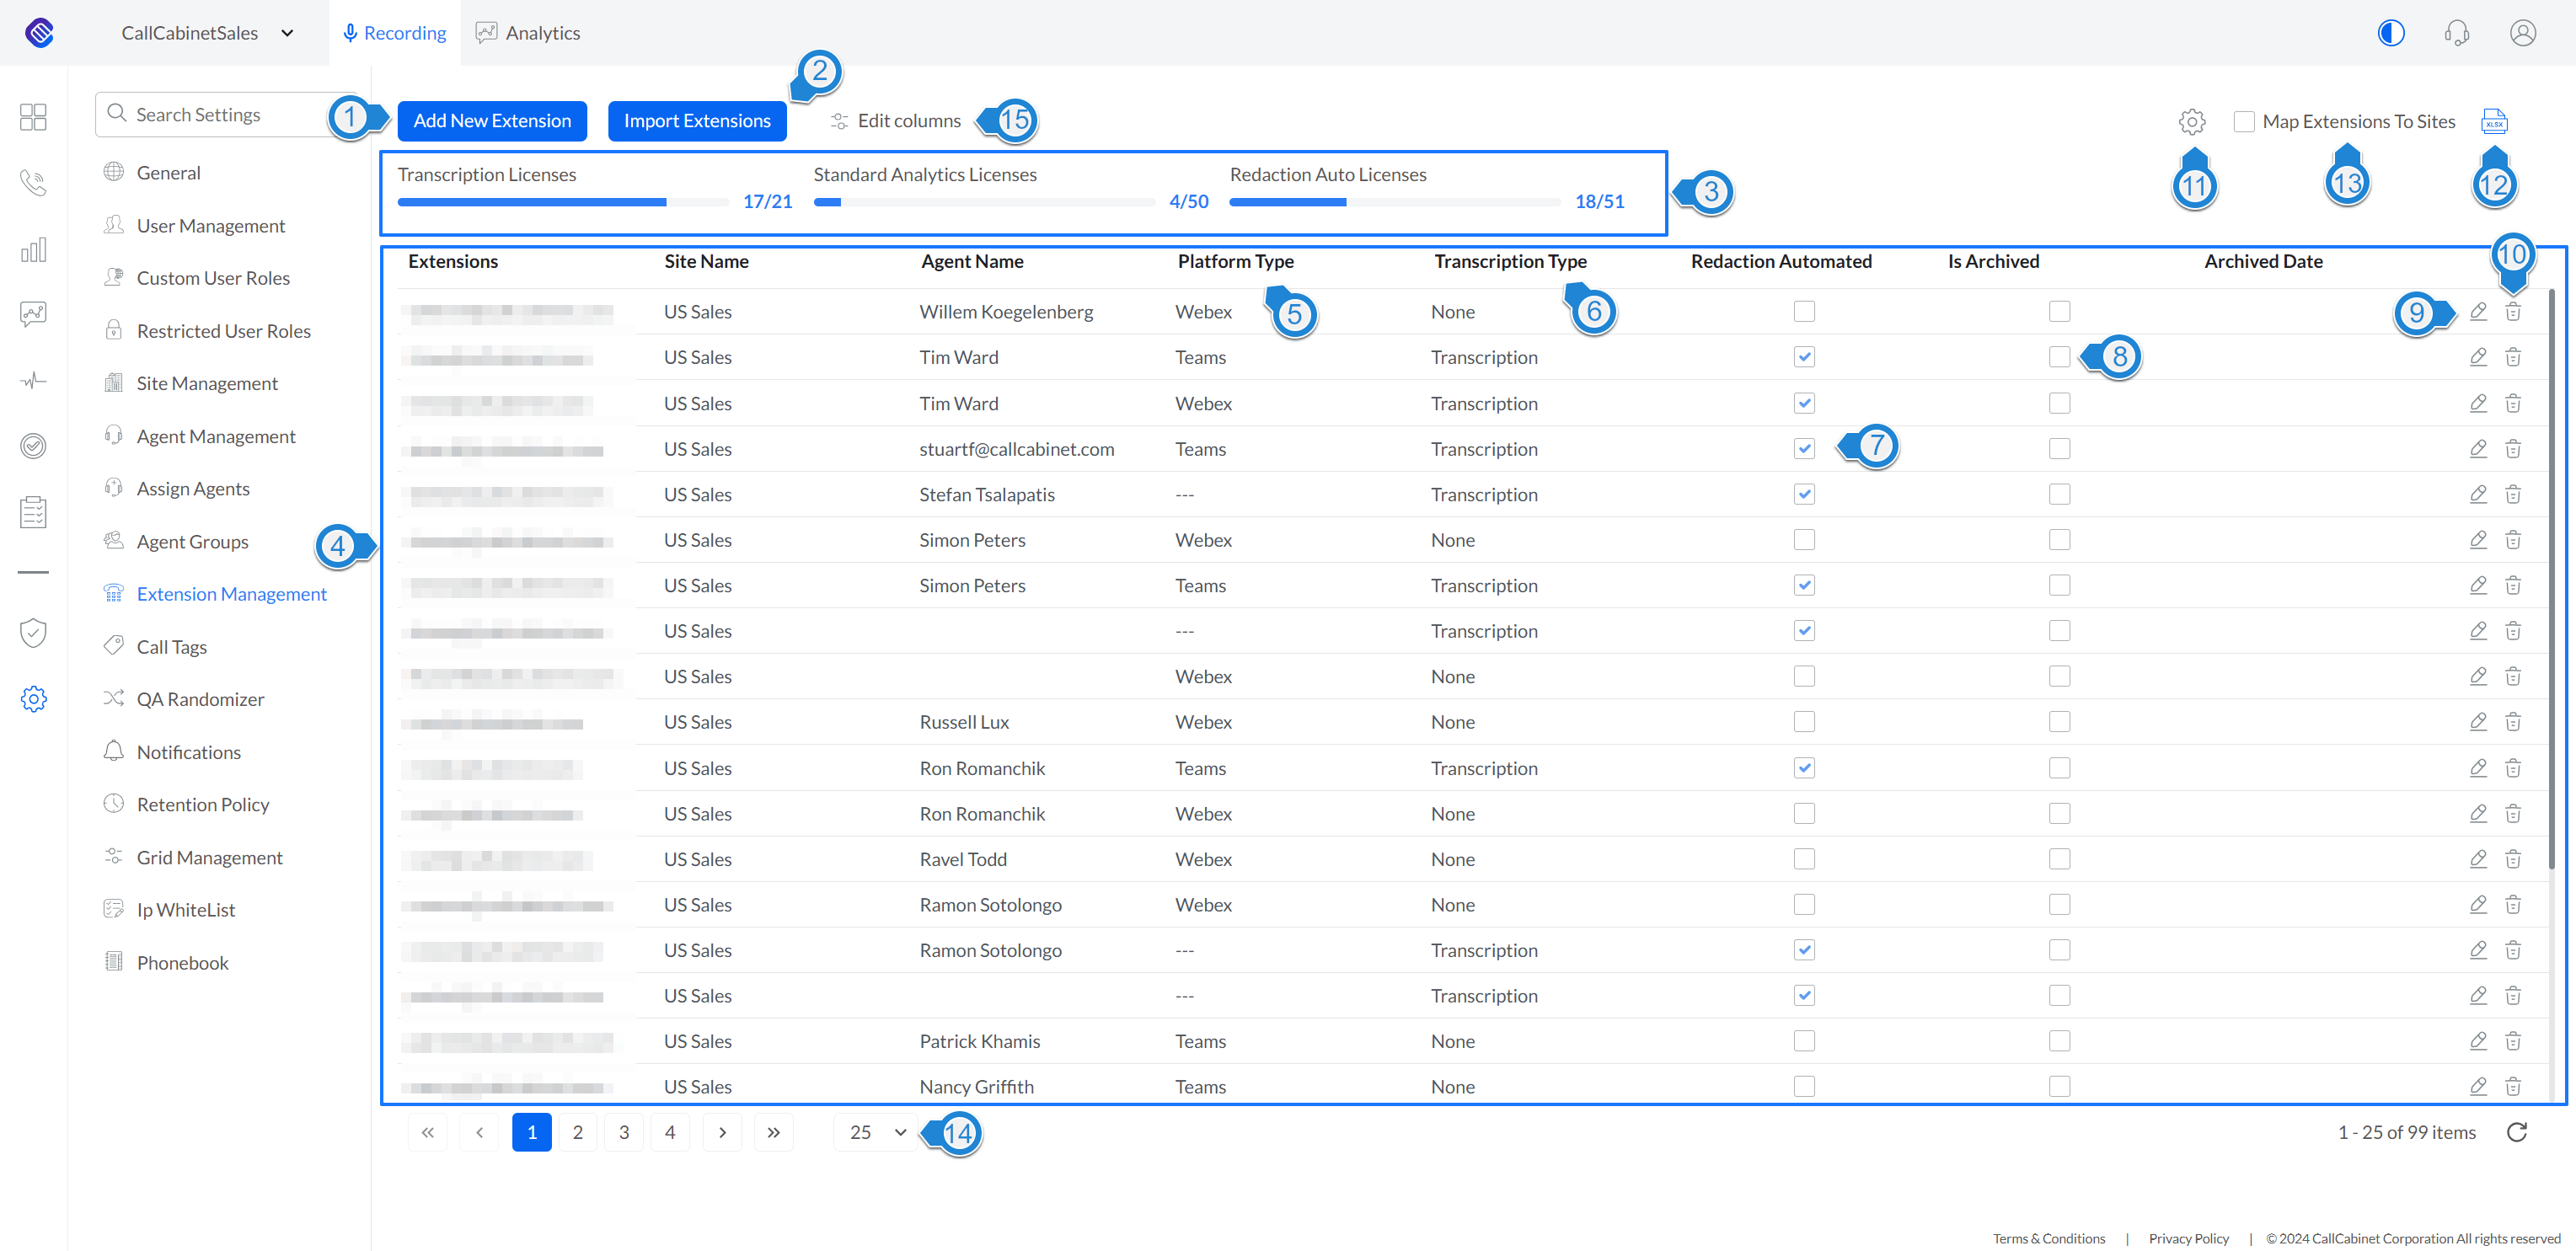
Figure – Extension Management
NOTE: Speech-to-text transcription is assigned per extension and can be managed here.
The numbers in the discussion below relate to the image in Figure – Extension Management:
- The Add New Extension button will permit the user to add a new extension. Pressing this button will result in an Add dialog to be rendered, as illustrated below. The user enters information in the Extension, Site Name and assigned Agent Name fields.

Recording Enabled will allow for the extension to be recorded. Turning this off by unchecking the checkbox will result in the extension no longer being recorded.
Platform Type will allow the admin user to select the platform on which the extension resides, for instance, Teams, Webex, SIP, Ring Central et cetera, from the dropdown list.
Transcription Type enables speech-to-text transcription on this extension, provided the relevant licensing has been provisioned. Transcription requires the extension the call accesses have the “Transcription Type” selected from the dropdown list that appears when clicked. The current options are;
- None
- Transcription
- Standard Analytics
- Advanced Analytics
Automatic PCI DSS redaction requires that the extension the call accesses has the “Redaction Automated” checkbox checked in its profile, and the agent associated with this extension has the “Manual PCI” checkbox unchecked in its profile. NOTE: Manual redaction is enabled under the agent’s profile accessed via the Settings > Agent Management menu item.
2N Redundant Recording Licenses displays the licenses dedicated for a fully mirrored recording environment, ensuring duplicate storage for business continuity. Extensions on secondary sites count against these licenses, improving system resilience for Avaya, BT IP Trade, and MS Teams integrations.
- Clicking on the Import Extensions button opens a dialog which permits the user to download a template, complete the required fields and upload the template to perform a bulk import of extension information. An example of the Import Extensions dialog is:

- All the licenses that have been purchased and consumed are listed in this portion of the view. In this example 21 Transcription licenses have been purchased of which 17 have been assigned to extensions. 50 Standard Analytics licenses have been purchased, 4 of which have been assigned to extensions, resulting in automatic Quality assurance taking place for those extensions, and 51 Transcription licenses have been purchased of which 18 have been assigned to extensions resulting in automatic PCI redaction occurring on those extensions.
- The Extension Data Table details all the current extension information such as the Extension, the Site Name, the assigned Agent Name and whether recording and speech-to-text Transcription has been enabled on the extension
- Platform Type indicates the platform the extension is associated with. For instance; Teams, Webex, SIP, et cetera
- Transcription Type column indicates whether transcription is enabled on the extension and whether it is basic Transcription or transcription required for Conversation Analytics
- Redaction Automated indicates whether the extension is enabled for automatic redaction. If it is, then a license is required.
- Is Archived indicates whether the extension and associated calls have been archived. If it has, then a license is required. See 10 below for further explanation on archiving an extension.
- The Edit Pencil icon permits the user to edit the associated extension where the admin user may, for instance enable or disable extension recording, change the transcription type for the extension as well as enable or disable automated redaction.
- The Trash icon permits the user to delete the associated extension. When the admin user clicks on this a dialog appears warning the user that they have requested to either delete or archive the extension and its associated calls. An example of this dialog is:

Should the user want to continue with the process, they would click ‘Yes’ which will result in the following dialog being rendered;
The user is presented with the option of deleting the extension, which will result in all the calls associated with this extension becoming deleted forever, or archive the calls in which case the extension is removed, but its calls will be archived. Should the user select the Archive option, CallCabinet will apply an ‘Archive Extension’ license to this extension resulting in the customer being billed each month for as long as the extension remains archived. To archive an extension, the license must have already been purchased and provisioned. Incidentally, these archived calls will be visible in the account’s Call Listing page. If the Is Archived column is visible in the Call Listing page, all calls that are archived will be marked as such in this column. If, on the other hand, the user selects Delete, then all the calls associated with the extension will be deleted and will no longer be available. NOTE: Once calls are deleted, they can never be recovered.
- Clicking on the Cog icon results in a Reassign Extension dialog appearing in which the user may re-assign an extension to an agent. An example of the dialog rendered is:

- The Excel icon, when clicked, will export the Extension Data Table in an xlsx file directly to the user’s desktop.
- The Map Extensions to Sites feature is checked when there may be duplicate extensions that need to be mapped.
- The Items per-page drop-down allows a user to change the number of extensions returned on each page. The range is from 25 – 2000.
- Clicking on Edit Columns allow the logged in user to change the columns the user would like to be visible in the Extension Data Table.
Each column in the data table can be sorted by clicking on the column name and filtering can be applied by clicking on the icon ![]() adjacent to the column heading which appears as the user passes their cursor over the column’s name to which the user is wanting to apply a filter. In the associated dialog that appears, the user will enter the criteria that are to be applied to the filter to produce the desired result.
adjacent to the column heading which appears as the user passes their cursor over the column’s name to which the user is wanting to apply a filter. In the associated dialog that appears, the user will enter the criteria that are to be applied to the filter to produce the desired result.
Call Tags

Figure – Call Tags
The Call Tags page is where the admin user is able to create, edit and delete Call Tags. Call Tags are applied to call recordings on both the Call Details and Call Listing pages as well as to a call that triggered a Notification, should this feature be enabled. Call Tags can be used as additional filtering parameters on the Call Listing page, helping users identify specific calls based on customized and thoughtfully applied Call Tags. A tag for instance could be called “Spam”. This tag may then be applied to a call, against which filtering may be applied.
The numbers in the discussion below relate to the image in Figure – Call Tags:
- Clicking on the Add a New Tag button will open an Add New Tag dialog where the user may enter the name of the new tag and click Save to save it. An example of this dialog is illustrated below:

- The Call Tags Data Table will display any call tags users have previously created and saved.
- The Edit Pencil icon permits the user to edit the tag.
- The Trash icon permits the user to delete the associated tag.
- The Show Inactive Tags checkbox, when checked, will show any inactive tags in the Call Tags Data Table. Inactive tags are those that have not been assigned to any call..
The Name column in the data table can be sorted by clicking on the column name and filtering can be applied by clicking on the icon ![]() adjacent to the column heading which appears as the user passes their cursor over the column’s name. In the associated dialog that appears, the user will enter the criteria that are to be applied to the filter to produce the desired result.
adjacent to the column heading which appears as the user passes their cursor over the column’s name. In the associated dialog that appears, the user will enter the criteria that are to be applied to the filter to produce the desired result.
QA Randomizer
This view is made up of three tabulated views, as illustrated by Figure QA Randomizer Settings Tabs. Each of these tabs and their associated view is discussed below.
NOTE: An Admin, Super Admin or Support User Role is required to access the QA Randomizer settings pages.

Figure – QA Randomizer Settings Tabs
The QA Randomizer view page allows the admin user to set additional controls for the QA Randomizer. The QA Randomizer tool removes the manual task of sourcing and handpicking a call for evaluation by randomly selecting a call for evaluation. The QA Randomizer is launched from the QA Dashboard page.

Figure – Randomizer Settings
The numbers in the discussion below relate to the image in Figure – Randomizer Settings:
- The Internal Calls checkbox, when checked, will include internal calls in the randomizer’s selection.
- The Stopped Calls checkbox, when checked, will include stopped calls in the randomizer’s selection.
- The From Date field defines a timeframe, measured in days passed that the randomizer will include when selecting call recordings for evaluation.
- Any changes made on this page will result in the Update button becoming enabled allowing for the user to save the changes by clicking on the button.
The numbers in the discussion below relate to the image in Figure – Randomizer Call Direction:
The Direction section allows the user to define what percentage of incoming and outgoing calls should be included in the randomized evaluation. Combined value must equal 100%.

Figure – Randomizer Call Direction
- The Incoming spinner field permits the user to enter the weighting that should be applied to incoming calls. For example; a value of 90 means 90% of the calls selected for evaluation will be incoming calls.
- The Outgoing spinner field permits the user to enter the weighting that should be applied to outgoing calls. For example; a value of 10 means 10% of the calls selected for evaluation will be outgoing calls.
- Any changes made on this page will result in the Update button becoming enabled allowing for the user to save the changes by clicking on the button.
The numbers in the discussion below relate to the image in Figure – Randomizer Agent Settings:

Figure – Randomizer Agent Settings
The Agents section is where an admin user assigns weights against agents to determine the randomness of them selected.
- The list of all agents.
- The admin user may assign a weight to agents, guiding the randomizer to include more or less of the agent’s calls. The higher the weight the greater the chance of selection in the random selection process. TO amplify this a little more;
When QA weights is equal to;- 0 then agents’ calls are not included in the randomizer queue.
- 50 then agents’ calls shown two times less often.
- 100 then agents’ calls show at the normal rate.
- 400 then agents’ calls show four times more often.
- 800 then agents’ calls show eight times more often.
- The Items per-page drop-down allows a user to change the number of tags returned on each page. The range is from 25 – 2000.
- Any changes made on this page will result in the Update button becoming enabled allowing for the user to save the changes by clicking on the button.
Each column in the data table can be sorted by clicking on the column name and filtering can be applied by clicking on the icon ![]() adjacent to the column heading which appears as the user passes their cursor over the column’s name the user is wanting to apply the filter. In the associated dialog that appears, the user will enter the criteria that are to be applied to the filter to produce the desired result.
adjacent to the column heading which appears as the user passes their cursor over the column’s name the user is wanting to apply the filter. In the associated dialog that appears, the user will enter the criteria that are to be applied to the filter to produce the desired result.
Notifications
The Notifications page allows a user to add alerts based on custom created rules. These notifications are triggered by the Quality Assessment (QA) evaluation process. This feature enables users who have the appropriate permission to track critical trends in their data and receive timely Notifications when significant changes occur. This assists a business in making appropriate decisions as a result of these real-time insights.
NOTE: An Analytics or QA License is required to activate this feature.
Depending upon whether an account has an Analytics license or not, the process of creating a notification differs.
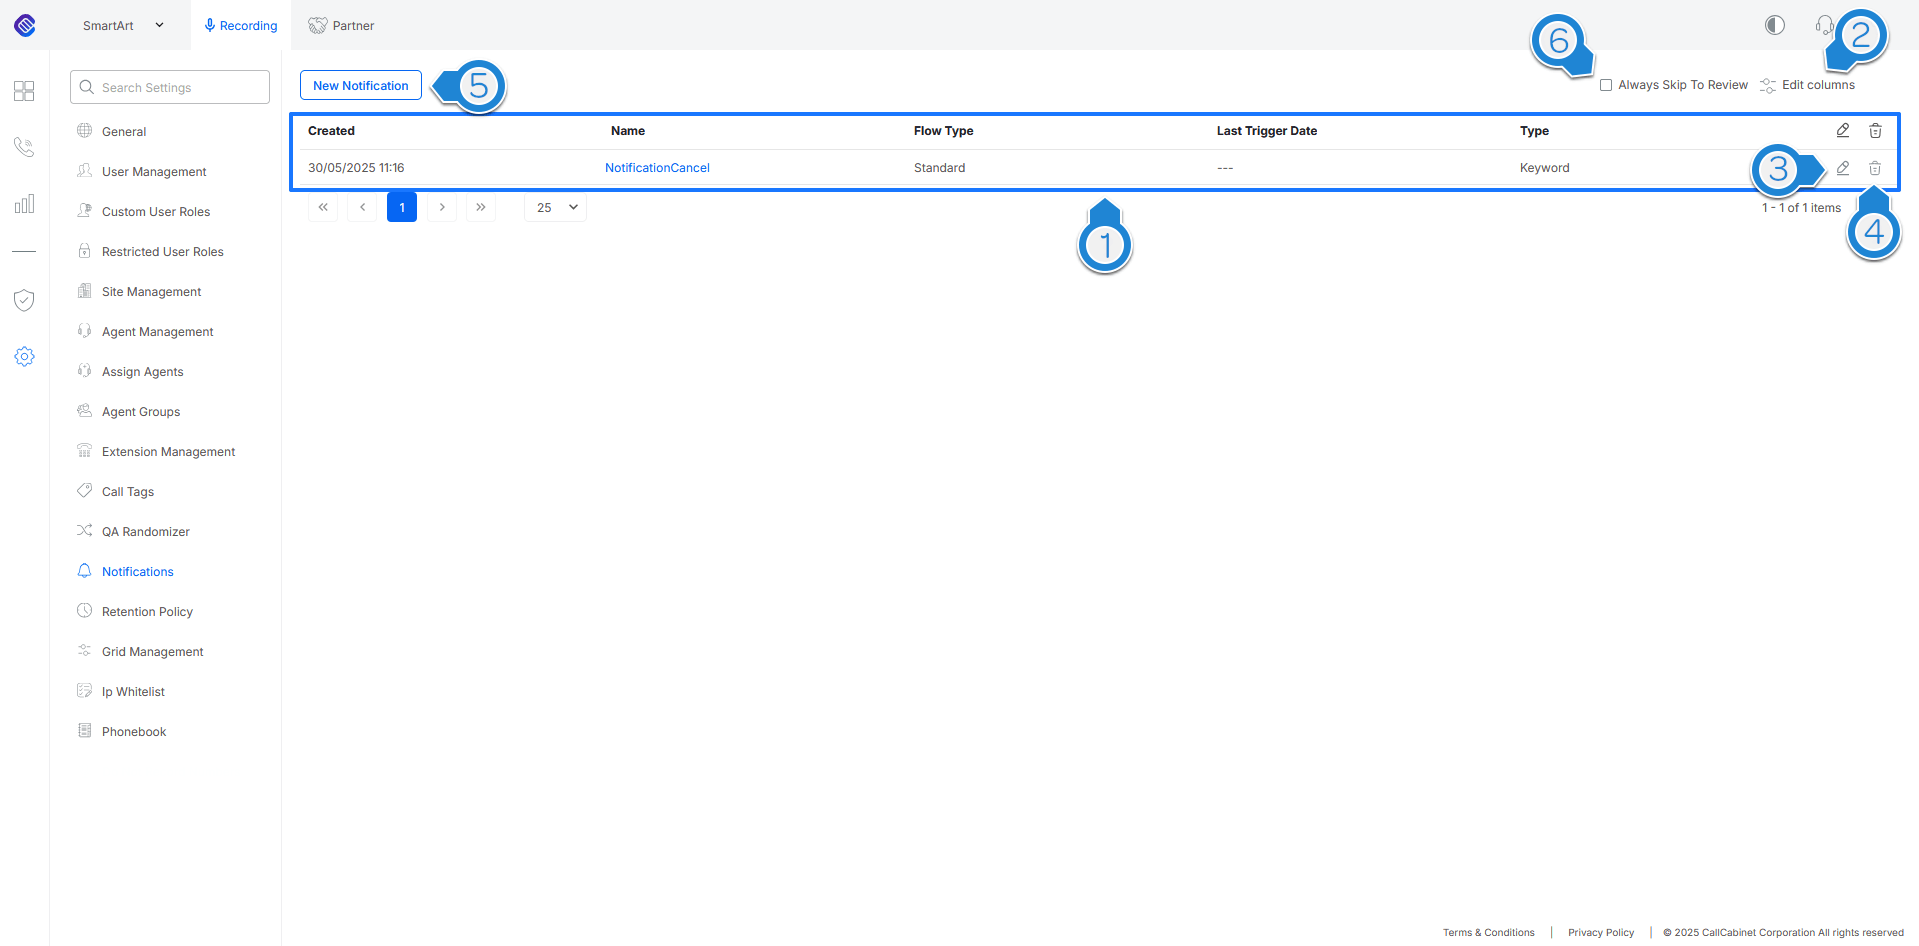
Figure – Standard Notifications
Notification Creation when account is NOT configured with Conversation Analytics
If the account is a ‘standard’ account and does not have an Analytic License provisioned, then an admin user clicks on Settings > Navigation sub-menu, the notifications page as illustrated in Figure – Standard Notifications. In this default page that is rendered all the current notification configurations are displayed in a table, as illustrated by 1. The table consists of a number of columns. These are;
- Created: The day and time the notification was created.
- Name: A meaningful name given to the notification.
- Flow Type: This indicates whether it is the Standard trigger flow or triggering that occurs during the Analytics flow process.
- Last Trigger Date: This is the latest date and time this event triggered a notification.
- Type: This details the event that will trigger a notification. For the standard notification this will be ‘Keyword’.
The admin user may decide which columns they would like visible, or removed from the notification table by clicking the ‘Edit Columns’ button illustrated by 2. From the dialog that appears the admin user may make the changes they require. Once done the admin user must not forget to click the Save button to enforce their changes. Should the admin user click the Default button in the Edit Columns dialog, then all possible columns are displayed in a predetermined order in the Notification table.
It is possible for an admin user to edit any of the notifications rendered in the table by clicking the Edit icon associated with the notification configuration they would like to change. This is illustrated by 3. Likewise, a notification may be removed by clicking on the Trash icon, as illustrated by 4, that is associated with the notification the admin user wishes to delete. This page provides the admin user with an overview of all the Notification event configurations that have been created.
If an admin user wishes to create a new Notification, there are two processes from which they may select. One, use the wizard, or two, go straight to the Review page and enter all the required information there. To create a new notification using the wizard, the admin user must make sure that the checkbox ‘Skip Wizard’ is unchecked illustrated by 6 in Figure – Standard Notifications, then go ahead and click the New Notification button as illustrated by 5 in Figure – Standard Notifications. This results in a ‘wizard’ being rendered, which guides the admin user through a step-by-step Notification creation process.
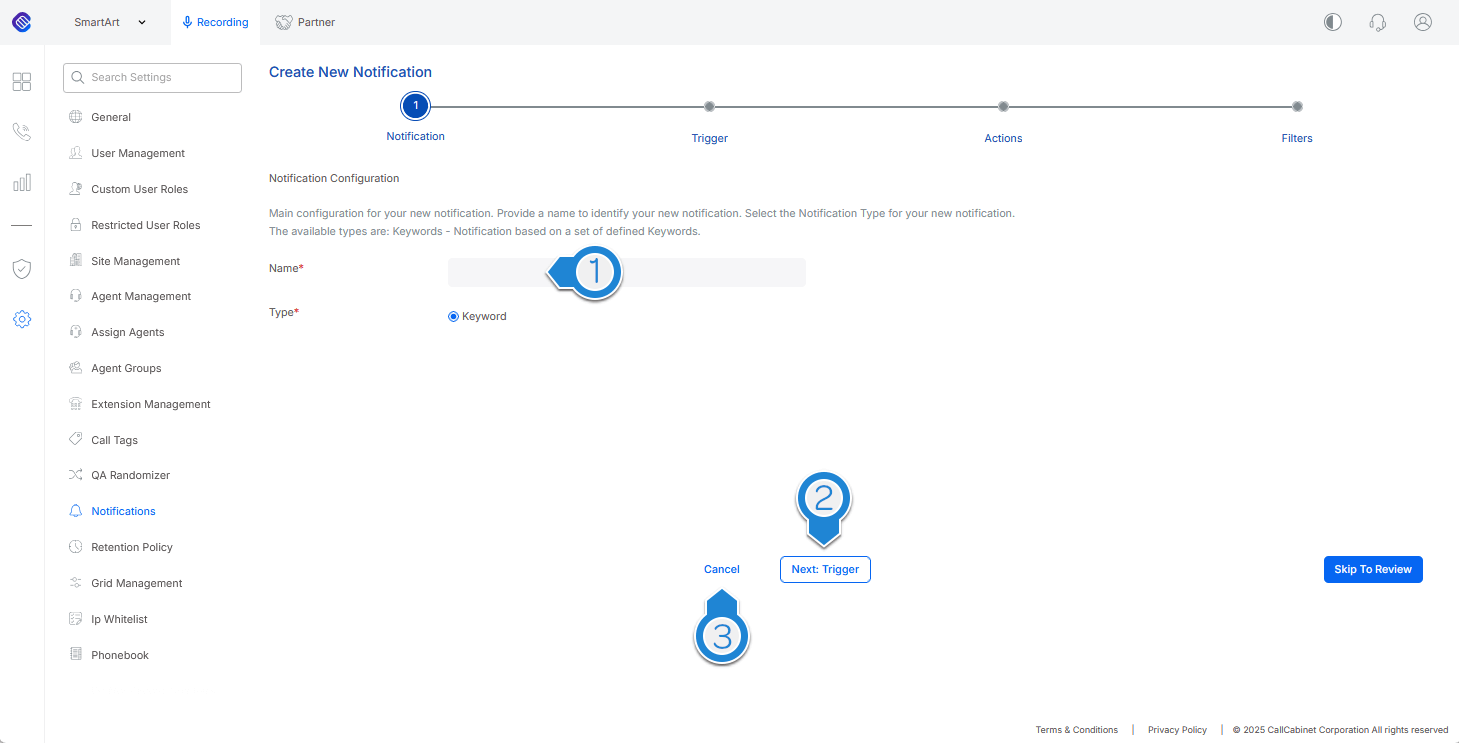
Figure – New Standard Notifications
The admin user enters the name they would like to give the notification into the Name field, as indicated by 1 in Figure – New Standard Notification. This is a required field. The admin user must ensure that the Keyword radio button is enabled. Once done, the admin user clicks the Next: Trigger button, illustrated by 2. Should the admin user want to exit creating a new Notification, they would click the Cancel button, illustrated by 3. An admin user may cancel at any stage of the process by clicking the Cancel button in any of the wizard’s views. By clicking the Next: Trigger button, the Trigger page is rendered. This is illustrated in Figure – Standard Trigger. The admin user enters the word that is to be detected, resulting in a Notification being raised. This is illustrated by 1 in Figure – Standard Trigger. When the word is triggered all related functions on the notification page will use this keyword. This word may be anything the user requires the system to trigger on, for instance, ‘cancel’ or a profanity.
Note: only one word or word phrase may be entered and is a required field.
Should the admin user want to change any information they entered in on the previous page, all they need to do is click the Previous button as illustrated by 2 in Figure – Standard Trigger. This is available in any of the wizard’s views. Once the admin user is happy with the trigger word or phrase they have entered, they click the Next: Actions button, illustrated by 3 in Figure – Standard Trigger to continue with setting up the Notification’s parameters.
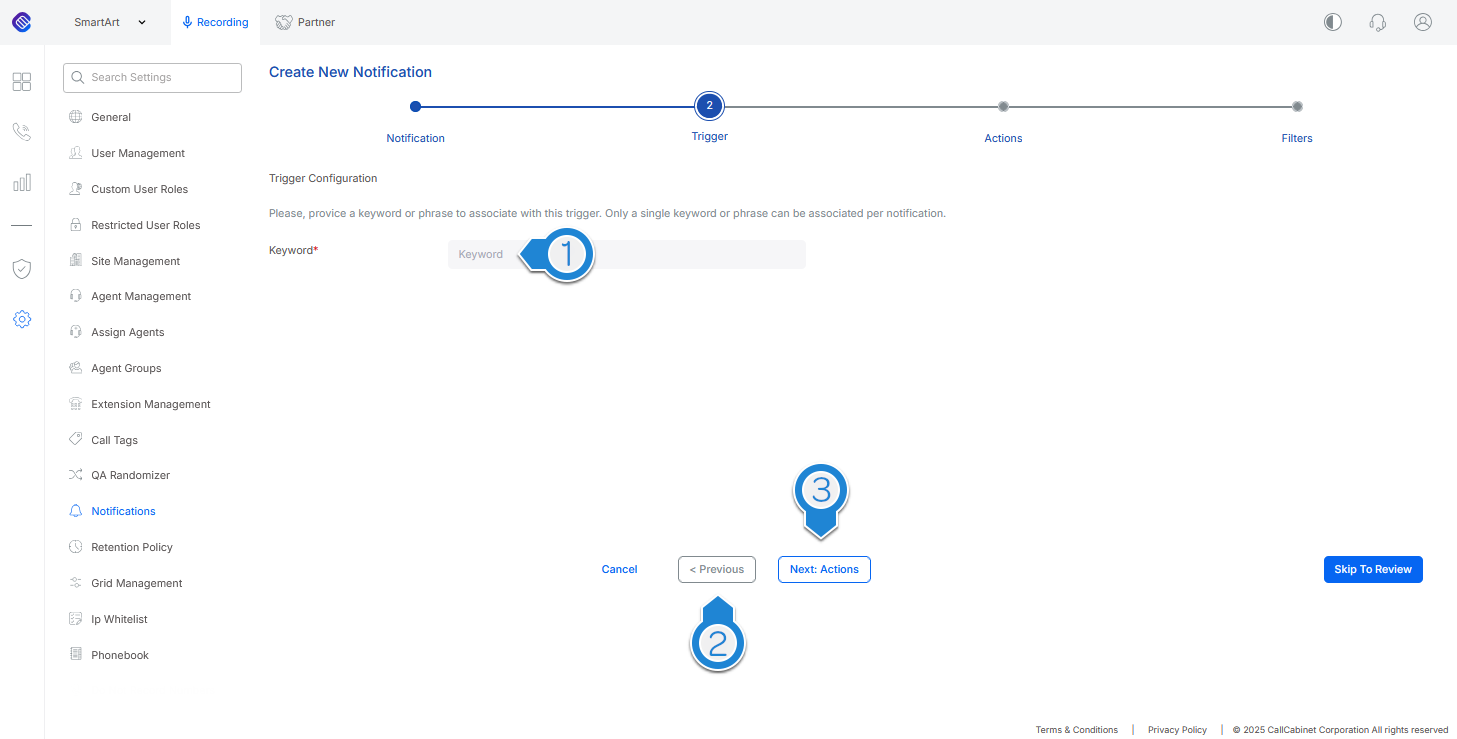
Figure – Standard Trigger
Once the admin user clicks the Next: Actions button, the wizard’s Actions page is rendered. This is illustrated in Figure – Standard Action.
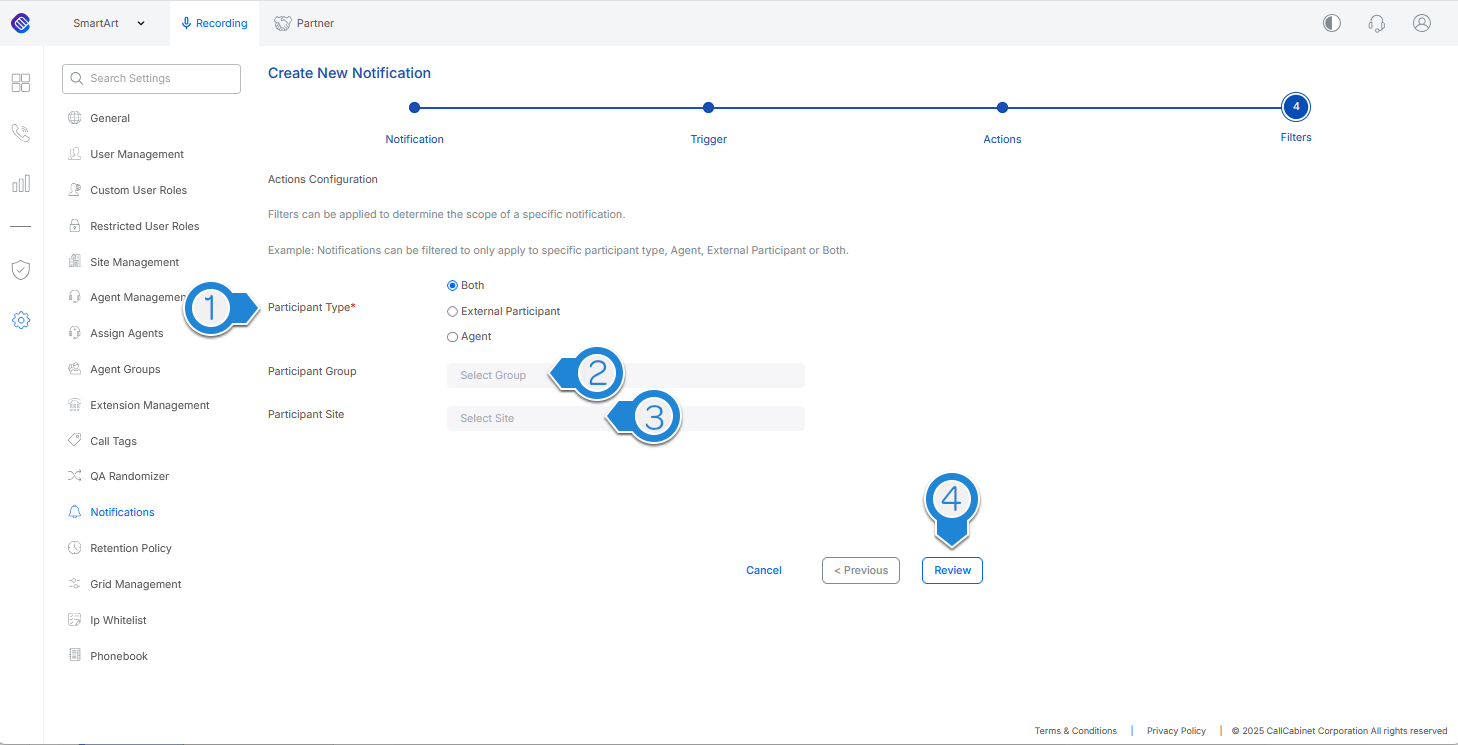
Figure – Standard Actions
This page requires the admin user to decide the action that is to be performed when a Notification occurs. A message may be sent to a Webhook endpoint, whose POST URL must be entered in the field illustrated by 1, or an email address, illustrated by 2, of the recipients, where each recipient’s address is separated by a semi-colon. What is important is that at least one of these actions must be applied. Either a Webhook endpoint, or an email action, or both.
Another action feature an admin user may activate, is to select the tags, if required, that should be attached to the call whose conversation triggers the notification. If one or more tags are selected from the Tag dropdown list, as illustrated by 3, when a conversation raises a notification, these tags will be attached to the call. A user may then use these flags as filter criteria when searching for calls that raised a notification from within the Call Listing page.
Once the admin user has determined the actions that are to occur when raising a notification, they click the Next: Filters button, as illustrated by 4 in Figure – Standard Action the wizard’s Filters page is rendered. This is illustrated in Figure – Standard Filters.
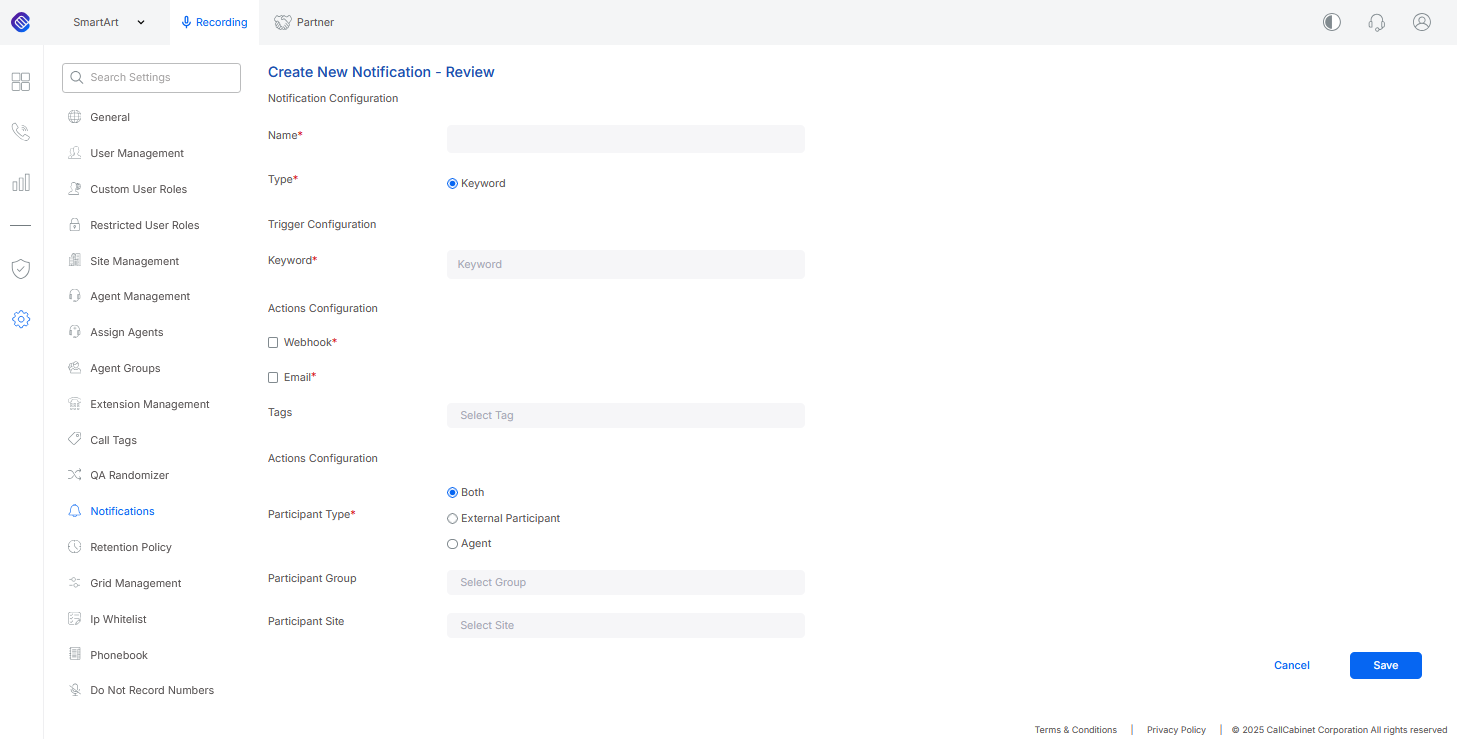
Figure – Standard Review
Should it be necessary, the admin user may make changes to any of the fields previously configured. Once happy with the Notification’s configuration, the admin user clicks the Save button, illustrated by 1 in Figure – Standard Review to save and ‘activate’ the newly created Notification. This will result in a confirmation dialog appearing in which the admin user must confirm the ‘activation’ of the Notification by clicking the Confirm button in the rendered dialog. An example of this confirmation dialog is illustrated below. Should the admin user not want to ‘activate’ the notification then they would click Cancel.
Once complete, this new notification will appear in the notifications table, illustrated by 3 in the Notifications page, as illustrated by Figure – Standard Notifications.
Finally, the other option of creating a new Notification is; if the admin user does not want to use the wizard to create a new notification but rather configure it all on one view, they may do so by checking the ‘Always Skip To Review’ checkbox, illustrated by 6 in Figure – Standard Notification and click the ‘New Notification’ button illustrated by 5 in Figure – Standard Notification. Doing so renders the Review page, as illustrated in Figure – Standard Review. The admin user may now configure the Notification all in one view, entering in all the required information and pressing Save, as illustrated by 1 in Figure – Standard Review, and confirming the notification creation. This will result in the new notification appearing in the notifications table, illustrated by 3 in the Notifications page, as illustrated by Figure – Standard Notifications
Notification Creation when account IS configured with Conversation Analytics
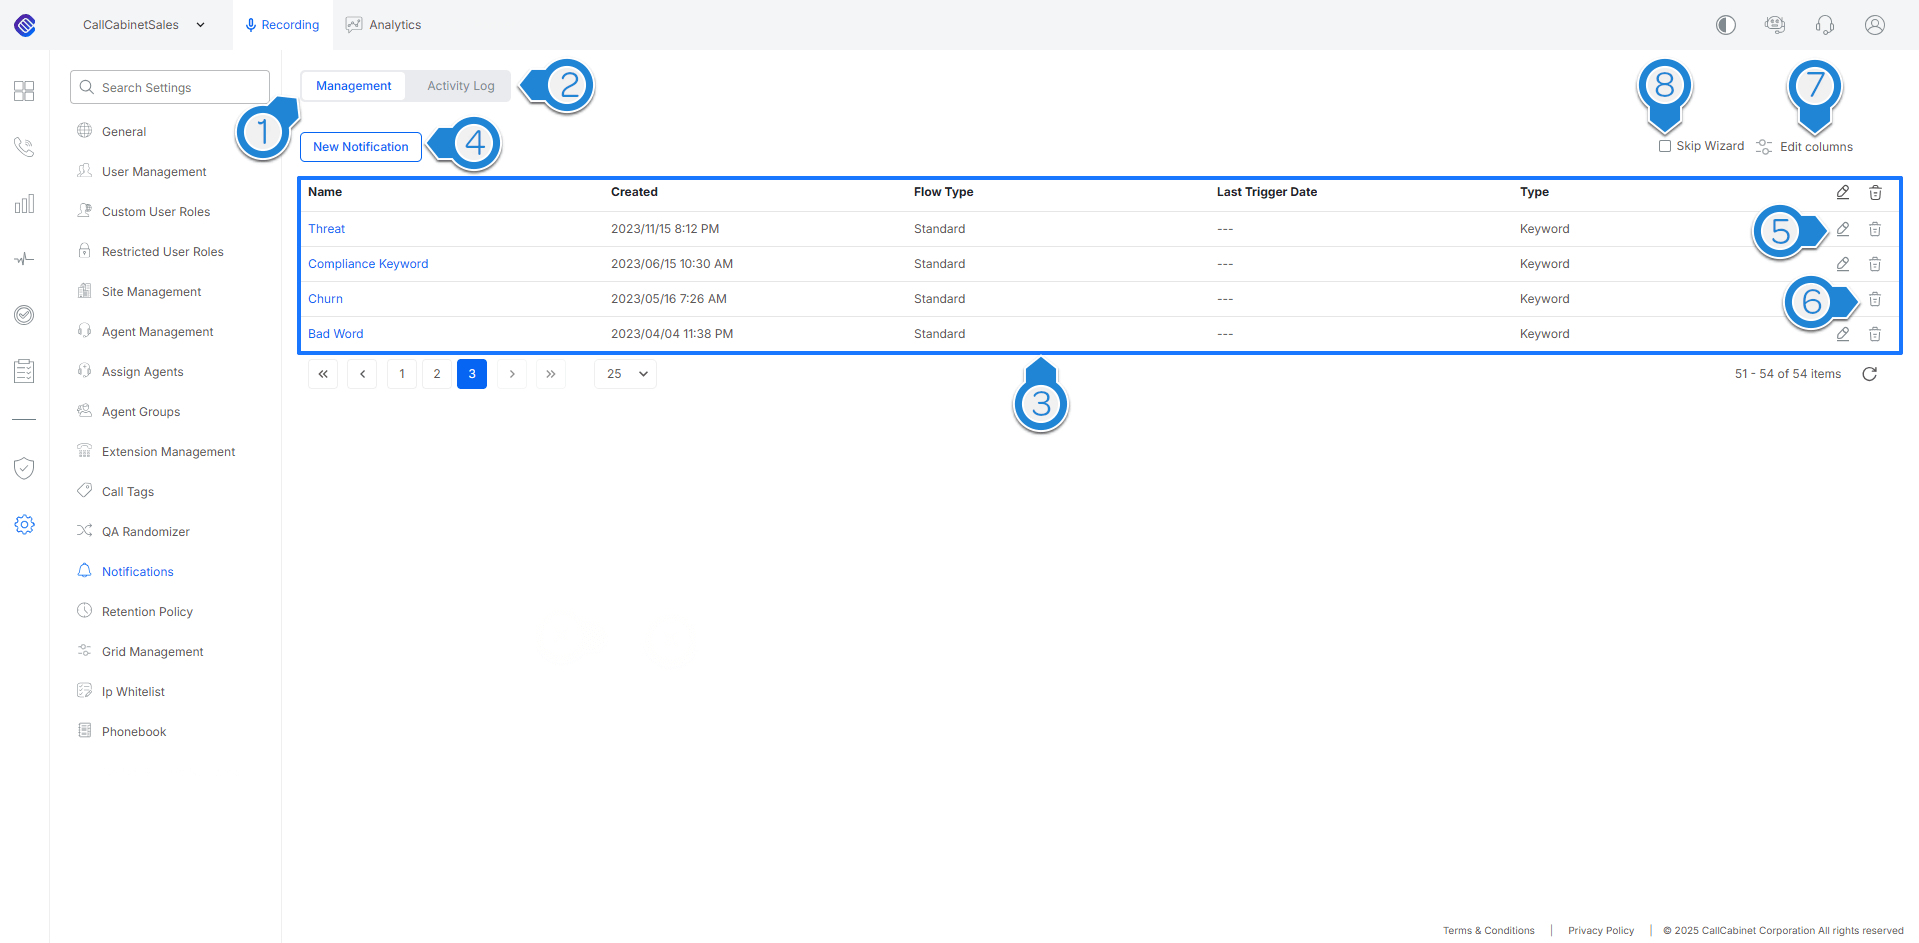
Figure – Notification
Should an admin user wish to create a new Notification on an account that is provisioned for Conversation Analytics, there are two processes they may select from. One, use the wizard, or two, go straight to the Review page and enter all the required information there. To create a new notification using the wizard, the admin user must make sure that the checkbox ‘Skip Wizard’ is unchecked illustrated by 8 in Figure – Notifications, then go ahead and click the New Notification button as illustrated by 4 in Figure – Notifications. This results in a ‘wizard’ being rendered, which guides the admin user through a step-by-step Notification creation process:
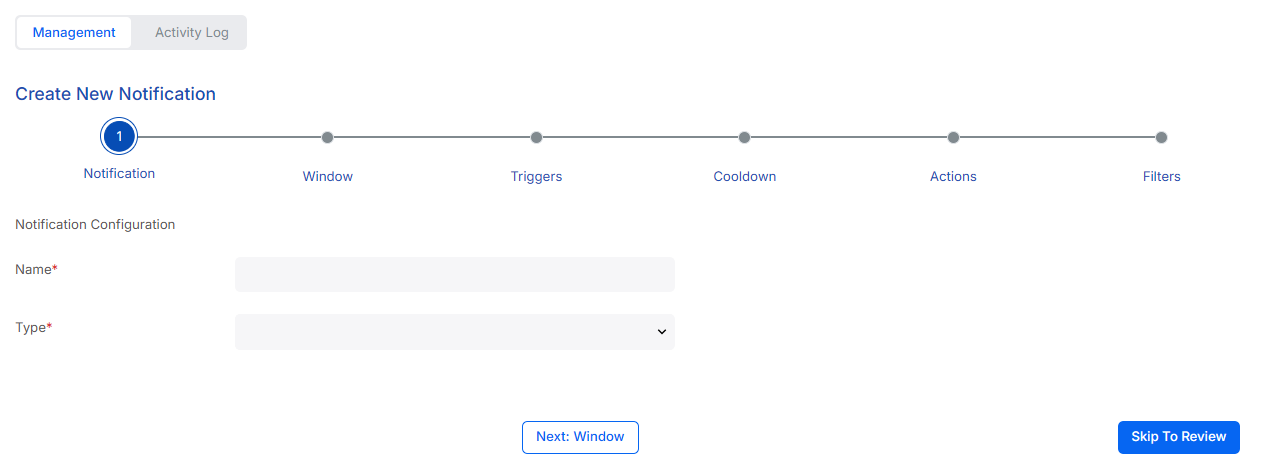
Figure – Notification Type
In this first page rendered, the admin user enters the name they would like to assign the notification they are creating by entering this in the Name field. Next, the admin user must decide the Notification Type from the Type dropdown list. The Notification Type represents the specific event that will trigger the creation of a Notification Event. The selected Notification Type defines the available Notification Triggers that will be further customized during the Notification Configuration process. An example of the Notification Type dropdown is;
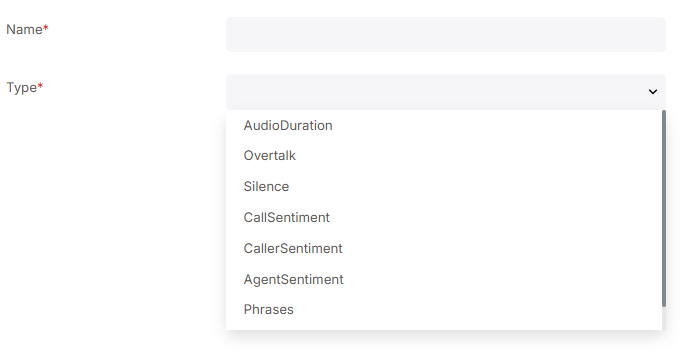
These Notification Type’s in the dropdown list are predefined by CallCabinet and are immutable. At the moment the Notification Type options are;
| Notification Type | Description |
|---|---|
| AudioDuration | he total duration of the call, measured in seconds, provides valuable insights into conversation length for enhanced performance tracking. |
| Overtalk | he percentage of the call where both parties spoke simultaneously, offering a clear view into communication dynamics and potential areas for improvement. |
| Silence | he percentage of the call marked by pauses or quiet moments, allowing you to gauge engagement and optimize call flow. |
| CallSentiment | A comprehensive analysis of the overall sentiment of the call, helping to assess the context of the conversation. |
| CallerSentiment | A breakdown of the caller’s sentiment throughout the call, providing insights into their satisfaction and engagement levels. |
| AgentSentiment | An analysis of the agent’s sentiment during the call, offering valuable feedback on their interaction style and effectiveness. |
| Phrases | A detailed list of key phrases detected during the call, enabling quick identification of critical topics and themes. |
| TopicDetection | Notifications triggered by the identification of predefined topics help to monitor specific areas of interest and ensure relevant discussions are highlighted. |
| QAScoring | Notifications triggered by the outcome of the QA Scorecard enable real-time monitoring of call quality and ensure compliance with performance standards. |
Once the admin user has entered the Name and selected the desired Type, they click the Next: Window button. The user is taken to the ‘Notification Window’ page, as illustrated by Figure – Notification Window.
NOTE: both the Name and Type fields are required fields, which means that they require values before the admin user is able to proceed to the next step in creating the Notification.
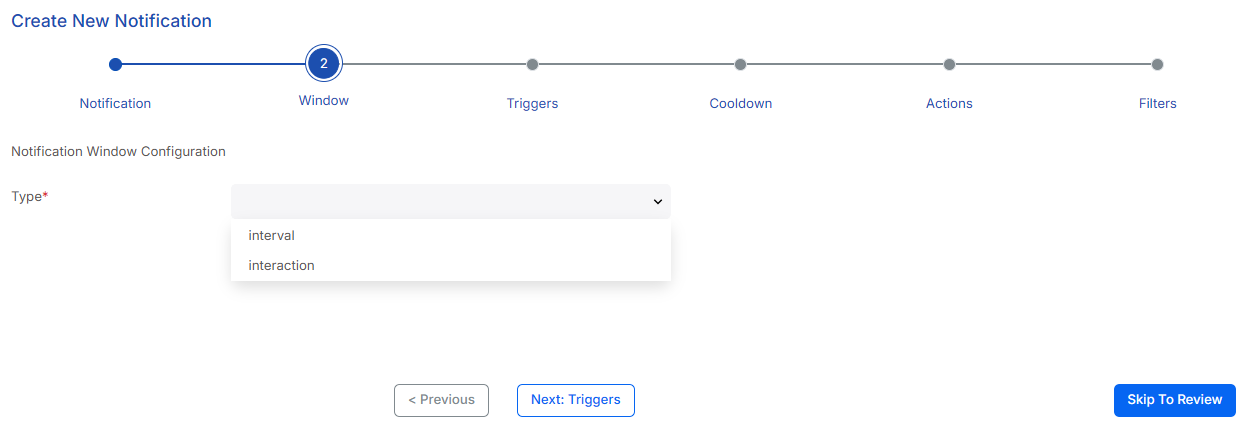
Figure – Notification Window
The Notification Window defines the call volume threshold required to trigger the notification. The admin user is first required to decide on the Window configuration type from the Type dropdown list. Currently there are two options, Interval and Interaction;
If the admin user selects Interval, they are then required to enter the timeframe in Hours in which calls should be grouped and then evaluated before triggering a Notification event. For example;
Likewise, should the admin user select Interaction, they are then required to enter the Number of Calls to be evaluated before triggering a Notification event. For example;
Once done, the admin user clicks the Next: Triggers button and is navigated to the Notification Triggers page, as illustrated by Figure – Notification Triggers.
NOTE: both fields are required fields, which means that they require values before the user is able to proceed to the next step in creating the Notification.
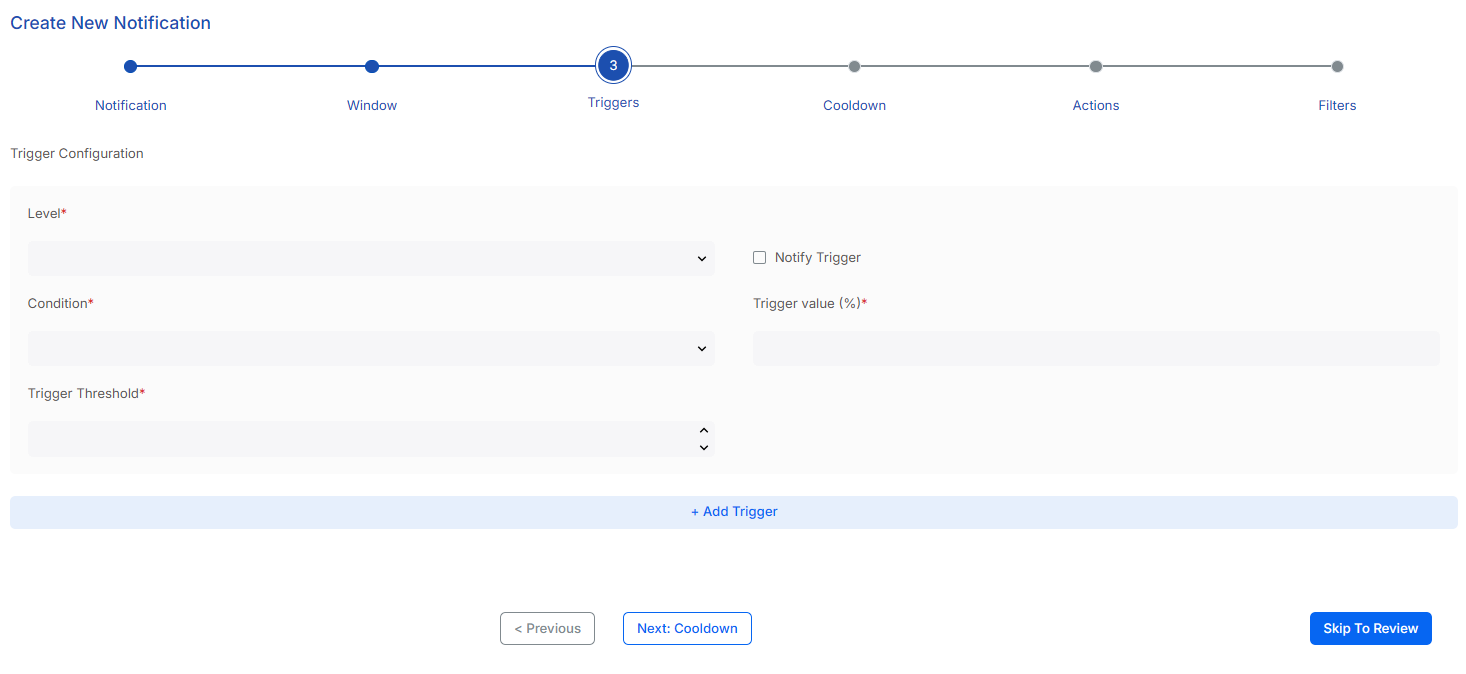
Figure – Notification triggers
A trigger is used to validate and trigger a Notification when the condition is met. An admin user is able to set a maximum of three triggers per Notification. So, Notification Triggers define the specific thresholds used to evaluate aggregated call data and determine whether a Notification Event should be created.
The level of the notification may be: Info, Warning or Critical. This level is selected from the Level dropdown list. Once the admin user has selected the Level, they must select the Condition and associated value.
NOTE: The options available in the Condition dropdown list is determined by the Notification Type selected earlier. For instance, if the user selected AudioDuration as the type, then the condition options are >= (greater-than or equal to) or <= (Less than or equal to). Likewise, if the admin user had selected a Notification Type of Phrases then the condition option is IN. Currently all possible options are
Examples of Trigger Conditions include:
- Less Than or Equal to ( <= )
- Greater Than or Equal to ( >= )
- IN (the value is within a specified list of values)
Once the admin user has selected the Condition, the value associated with that condition must be entered.
Each Trigger has the option to enable Notify Trigger. When selected, the trigger will send a push notification through notification channels such as an email or webhook. The configuration of these notification methods will be done later in the process. If the admin user does not check this checkbox, then the trigger will not be sent but will be entered into the Activity log.
If the admin user would like to add another trigger Condition, they would click the +Add Trigger button that appears across the notification Trigger screen as illustrated in Figure – Notification Triggers.
The admin user proceeds to the next page once all the required fields have been populated with information, by clicking the Next: Cooldown button. This results in the Cooldown page being rendered, as illustrated in Figure – Notification Cooldown.
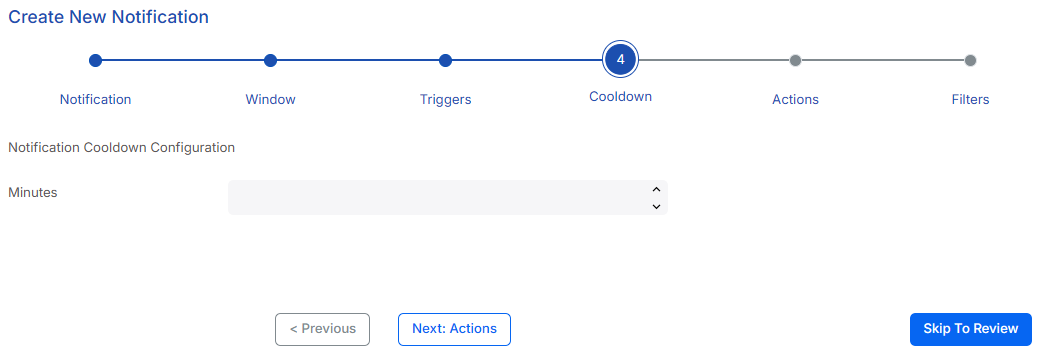
Figure – Notification Cooldown
A Notification Cooldown period configures the amount of time that must pass after a notification is sent before another notification may be issued. This helps prevent users from receiving excessive notifications (i.e. being spammed) in short time frames. The time interval is set in Minutes, where the minimum allowed interval is 30 minutes. Once the Cooldown period has been set, the admin user moves onto the next page, Notification Actions by clicking the Next: Actions button.
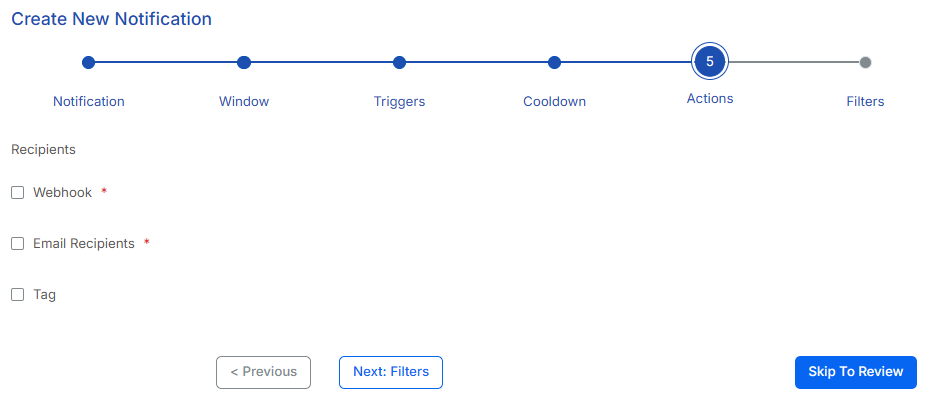
Figure – Notification Actions
Push notifications inform users about a new Notification Event. Please ensure that the Notify Trigger option is enabled when configuring Notification Triggers to activate notifications. Webhook is a POST URL where notifications will be sent. When the admin user checks this checkbox, the Webhook’s URL must be entered into the field that appears. Email is the email address where the notification will be sent when this checkbox is checked. When this is checked an email field appears in which the admin user may enter a list of comma-separated email addresses of the recipients to which the Notification event is to be sent.
Should the admin user want a Tag to be attached to the call that resulted in a Notification Event to occur, then they would check this box, and from the dropdown list which contains all configured Tags, select the Tag they would like to be attached to the call. This is very useful, as a user is then able to filter all calls in the Call Listing page that have the Tag attached.
An example of a Notification that may be sent is:

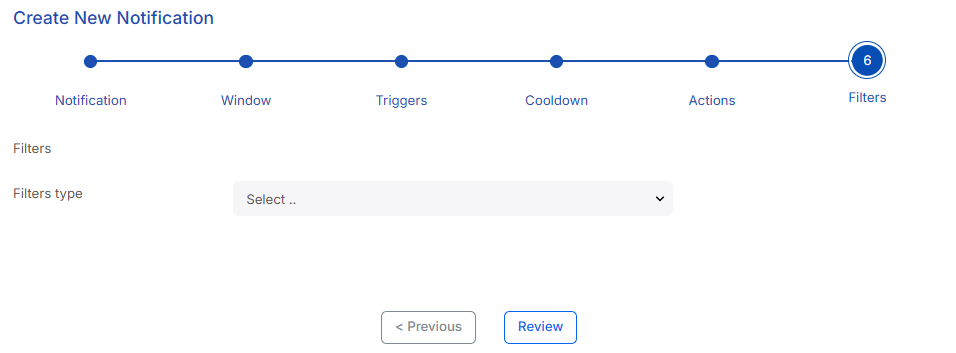
Figure – Notification Filters
Once the admin user has completed entering the required Notification Actions, they would click the Next: Filtersbutton which results in the Navigation Filters page being rendered, as illustrated in Figure – Notification Filters. Notification Filters allows for greater control by allowing an Admin user to specify which interactions should be considered when evaluating Notification Triggers. For instance, the admin user can limit a Notification to specific Agents or Groups of Agents as well as Sites, by clicking on the Filters Type dropdown list. The current filter options are;
| Filter | Description |
| AudioDurationLessThan | Filters interactions where the call duration (in seconds) is lower than the specified value. |
| AudioDurationGreaterThan | Filters interactions where the call duration (in seconds) exceeds the specified value. |
| SiteName | Filters interactions based on the site associated with the interaction. |
| AgentGroups | Filters interactions based on the specific agent groups handling the interactions. |
| Agent | Filters interactions based on the specific agent who handled them. |
| SilenceLessThan | Filters interactions where the level of silence, measured on a scale from 0 to 1, is lower than the specified value. |
| SilenceGreaterThan | Filters interactions where the level of silence, measured on a scale from 0 to 1, exceeds the specified value. |
| OvertalkLessThan | Filters interactions where the level of overtalk, measured on a scale from 0 to 1, is lower than the specified value. |
| OvertalkGreaterThan | Filters interactions where the level of overtalk, measured on a scale from 0 to 1, exceeds the specified value. |
| SentimentLessThan | Filters interactions where the call sentiment, measured on a scale from -1 (negative) to 1 (positive), is less than the specified value. |
| SentimentGreaterThan | Filters interactions where the call sentiment, measured on a scale from -1 (negative) to 1 (positive), is greater than the specified value. |
The final step in creating a Notification is clicking the Review button. A page rendering the complete configuration parameters set for the Notification. An example of this is illustrated in Figure – Notification Review. The admin user may edit any of the fields, if necessary. Once the Admin user is satisfied with the Notification’s configuration, they must click the Save button to save the newly created Notification. Should any of the Notification’s conditions be met, a Notification Event is generated and at a minimum, logged.

Figure – Notification Review
If an admin user wishes to create a new Notification, without making use of the wizard, as described above then they would check (enable) the checkbox ‘Skip Wizard’ illustrated by 8 in Figure – Notifications, then click the New Notification button as illustrated by 4 in Figure – Notifications. This will result in the admin user being taken directly to the Review page in which they may enter all the Notification configuration details in one convenient view. Once they have entered all the pertinent information they would click Save to save the Notification’s configuration. An example of the ‘blank’ review page is illustrated in Figure – Notification Blank Review

Figure – Notification Blank Review
Referring back to Figure – Notifications, there are two tablatures rendered; the Management tablature illustrated by 1 and the Activity Log tablature, illustrated by 2. We have discussed the Management tablature.
When the admin user clicks the Activity Log tablature, in which all Notifications that have occurred are rendered in the table. This table provides a detailed overview of past notifications, enabling the admin user to effectively monitor and analyze Notification Events with precise information on when and why they were triggered. An example of this Activity log is illustrated in Figure – Notification Activity Log.

Figure – Notification Activity Log
Each Notification Log includes the following key details:
- Time Stamp: The exact time when the Notification was triggered.
- Title: The name of the admin for easy identification.
- Type & Level: The category and severity of the admin.
- Description: A concise explanation of the event that triggered the admin.
- Notification: Whether a notification was sent.
- Triggered Calls: The number of calls that triggered the admin.
By clicking on any notification, an admin user may access additional in-depth information, including:
- Condition: The specific metric that was being monitored.
- Trigger: The rule or threshold that activated the notification.
- Call Link:
 A direct link to the recorded call for further review.
Overprovisioning Notifications
CallCabinet has a feature ‘License Consumption Control’, which, if enabled will result in an admin user being informed of the fact that they have overconsumed licenses. If the admin user does, then a Notification is raised.
As part of this explanation, let’s look at a scenario as an example. Assume a customer is using MSTeams and has purchased five Recording licenses. For each user the customer wants recorded, the customer’s Azure Administrator will add them to the appropriate AD group. As each one of these users execute their first call, one of the available Recording licenses will be applied to their extension automatically. Should only five users be added to the group and they all make a call, then all five of the available Recording licenses will be consumed, and there is no license issue
However, should the Azure Administrator decide to add another user to the AD group, and this user then makes a call, CallCabinet will automatically assign this user a Recording license and record their calls. However, the customer has not purchased this extra license. If the ‘License Consumption Control’ feature is enabled, CallCabinet will still record this extension, however these calls will not be visible in the customer’s Call Listing page.
If this is the case, CallCabinet will inform the customer that they have overconsumed Recording licenses by means of a notification, surfaced by a Notification Bell that appears in the customer’s page banner in the CallCabinet application. This is illustrated by 1 in Figure – Overconsumption Notification.

Figure – Overconsumption Notification
When the customer’s admin user clicks this icon, the notification’s message is displayed. An example of this message is;

When the customer’s admin user realizes they are not seeing the calls associated with this extension in their Call Listing page, and reads the notification message, they will need to contact their partner as described in the Notifications alert. The customer’s admin user is also instructed, in the notification’s message, to view their Extension Management page located under Settings > Extension Management.
When an admin user navigates to this page, they are able to view a new column, Recording Licenses. This page is illustrated in the Figure – Extension Management. The Recording Licenses column illustrated by 1, indicates which of the extensions have been assigned a recording license. If the checkbox is ‘ticked’ then that extension associated with the checkbox has a recording license assigned.

Figure – Extension Management
Once the customer realizes overconsumed Recording licenses has occurred, they have a couple of choices;
- One choice is to purchase an additional Recording license. If they decide to do this, then the partner will provision this new, additional Recording license.
Once the new license has been applied to the account, the customer’s admin user would proceed to Settings > Extension Management, in their account, select the appropriate extension and click its Edit icon, as indicated by 2 in Figure – Extension Management, and manually assign this new Recording license to the extension. Any calls recorded and hidden before the license was assigned will now be made visible in the customer’s Call Listing page.
Note: As these ‘hidden’ calls age and become ‘older’ than 30 days, they will be purged unless a license is properly assigned to the extension.
As the new Recording license is consumed by this extension, the customer will be correctly billed for the extra Recording license. - The second choice is if an agent is no longer being recorded on an extension, then that extension may be removed, thereby releasing the Recording license consumed by that extension. However, when removing the extension, the customer’s administrator needs to make another decision, and that is, do they want the calls to be available after the extension is deleted? If they do not want to retain the calls, then when the customer’s admin user deletes the extension, all the calls associated with that extension will be deleted. The Recording license then becomes available and can be manually assigned to a new extension whose calls are to be recorded. When the admin user decides to delete an extension by pressing on the ‘trash’ icon associated with that extension, as indicated by 3 in Figure – Extension Management, the following dialog appears;
The admin user must confirm that the calls are to be deleted, by clicking ‘Yes’. This will result in another dialog appearing in which they need to select the ‘Delete’ button to delete the extension, and remove all associated calls.
However, should the customer’s admin user want to retain the calls and make them available in the Call Listing page, then the first thing the customer’s admin user must do is contact their partner and purchase an Archive License. Please note though; should an extension have less than 100 calls, then an Archive License is not required to archive these calls. Once this license has been applied to the account by the partner, then the admin user can continue in archiving the calls by proceeding to the extension whose calls are to be archived, and press the ‘trash’ icon ![]() associated with that extension as indicated by 3 in the Extension Management image. This results in the following dialog appearing:
associated with that extension as indicated by 3 in the Extension Management image. This results in the following dialog appearing:
The admin user must confirm that they want to archive the calls by clicking ‘Yes’. This will result in another dialog appearing in which they need to select the ‘Archive’ button to archive all the extension’s associated calls.
Once the customer’s admin user does this, the calls are archived, the extension is marked as archived as well as the date and time the extension was archived (as illustrated by 4 in the Extension Management image) and the Recording license is made available to be manually assigned to another extension whose calls are to be recorded.
Note: An Archive License must be purchased before any extension’s calls are to be archived and that extension marked as archived. This cannot be done retrospectively. Be aware though, any extension that has less than 100 calls, then no Archive License is required to archive these calls.
Retention Policy
The Retention Policy page allows an admin user to define the data retention policy per site. The retention

Figure – Retention Policy
period is always in terms of days. This therefore implies that year periods must be translated into their days equivalent.
NOTE: The minimum retention period is 180 days for storage-based accounts and 1 day for Per Seat based accounts.
The numbers in the discussion below relate to the image in Figure Retention Policy:
- The Retention Policy Data Table displays a list of all current sites and their associated retention periods, measured in days.
- The Edit icon permits the user to edit the retention policy associated with the site. The user, when editing, is able to set the number of days of retention or flag it to Never
Each column in the data table can be sorted by clicking on the column name and filtering can be applied by clicking on the icon ![]() adjacent to the column heading which appears as the user passes their cursor over the column’s name the user is wanting to apply the filter. In the associated dialog that appears, the user will enter the criteria that are to be applied to the filter to produce the desired result.
adjacent to the column heading which appears as the user passes their cursor over the column’s name the user is wanting to apply the filter. In the associated dialog that appears, the user will enter the criteria that are to be applied to the filter to produce the desired result.
Grid Management

Figure – Managing Data Table Columns
A user with the requisite role, such as Super Admin is able to assign the default columns visible for all users, for instance on the Call Listing Page. Incidentally, a user may still add or remove columns, as well as order the columns to meet their personal preference.
The numbers in the discussion below relate to the image in Figure – Managing Data Table Columns
- Grid Types display the list of pages on which columns can be added, removed or ordered.
- Available Columns displays the list of columns that are currently hidden in the selected page’s data table, in this example, the Call Listing Page.
- Visible Columns displays the list of columns that are currently visible in the selected page’s data table, in this example, the Call Listing Page.
To manipulate the columns the user must first press on the name of the page under the Grid Types column (labeled 1). To make a column visible, the user would left-press their mouse button on the column name in the available column and then keeping the left button depressed, drag the column name to the visible column. The user may also move the column name up or down in this list, to set the order of the columns. To remove a column, the process is the same except that the user drags the name from the visible column to the available column.

Figure – Locking Grid Columns
The numbers in the discussion below relate to the image in Figure Locking Grid Columns.
A user is able to lock the columns preventing removal or ordering. To do this, the user would first click on the edit icon![]() , labeled 2, next to the page name in the Grid Types column, labeled 1. Doing so will render a screen similar to that displayed in Figure – Locking Grid Columns. If a user clicks on the column name, labeled 3, they will be able to lock or unlock a column. Locking the column, prevents a user from removing it from, or reordering it on the Call Listing page view. A column that is locked
, labeled 2, next to the page name in the Grid Types column, labeled 1. Doing so will render a screen similar to that displayed in Figure – Locking Grid Columns. If a user clicks on the column name, labeled 3, they will be able to lock or unlock a column. Locking the column, prevents a user from removing it from, or reordering it on the Call Listing page view. A column that is locked ![]() will look similar to that indicated by 4 Incidentally, once the column is unlocked, the user may remove the column. Once all the desired changes are made and all the columns are locked the user may save the grid structure by clicking on the Save button, indicated by 5.
will look similar to that indicated by 4 Incidentally, once the column is unlocked, the user may remove the column. Once all the desired changes are made and all the columns are locked the user may save the grid structure by clicking on the Save button, indicated by 5.
IP WhiteList

Figure – IP Whitelist
The IP WhiteList page allows an admin user to restrict login access to CallCabinet by specifying an IP address and enabling the IP WhiteList feature. By checking the Use IP Whitelist check box and the user entering their password to verify their identity limits access to CallCabinet from any IP Addresses other than those specified in the IP Address list.
The numbers in the discussion below relate to the image in Figure – IP Whitelist:
- Clicking on the Use IP WhiteList checkbox enables the whitelist. However, before being enabled the user needs to enter their credentials in the dialog that is rendered. If the credentials are valid, the whitelist is enabled. An example of this dialog is illustrated below:

Once the whitelist is enabled users may only login from IPs in the IP address list. - Clicking on the Add a new IP Address button allows the user with the requisite permission to add a new IP address to IP Address whitelist. This button is enabled once the Use IP WhiteList checkbox is enabled.
- Table of whitelisted IP addresses. Remember, these IP addresses are outward facing IP addresses.
- The Edit icon permits the user to edit the associated IP Address. This icon is enabled once the Use IP WhiteList checkbox is enabled.
- The Trash icon permits the user to delete the associated IP Address. This icon is enabled once the Use IP WhiteList checkbox is enabled.
Phonebook
The Phonebook page allows the user to build a directory of contacts in CallCabinet. A phonebook is similar to that in a person’s cell or mobile phone, where a user adds numbers and names. This is a useful feature incorporated in the Call Listing Page. Should there be a phone number or email address, with an associated name present in the Phonebook, then the Phone Book field will be updated to contain the name associated with the number or email address in the Call Listing Page.

Figure 65 – Phonebook
The numbers in the discussion below relate to the image in Figure – Phonebook:
- The Phonebook Data Table displays a list of all the current contacts in the phonebook.
- Edit icon permits the user to edit the associated phonebook contact.
- The Trash icon permits the user to delete the associated phonebook contact.
- The Excel
 icon, when clicked, will export the Phonebook Data Table in an xlsx file directly to the user’s desktop.
 - Clicking on the Add New Phone Book permits a user to add a contact to the Phonebook, which consists of the contact’s name and phone number. Clicking this button results in a dialog being rendered in which the user may enter the relevant information. An example of this dialog is illustrated below:

- Clicking on the Import Phone Book button opens a dialog which permits the user to download a template, complete the required fields and upload the template to perform a bulk import of phone book information. An example of the Import Phone Book dialog is:

Conversation Analytics Portal – Analytics Tab
Data analytics is the process of analyzing raw data in order to draw out meaningful and actionable insights. At CallCabinet we use the term Conversation Analytics. The Analytics page is an analytics dashboard reflecting voice data intelligence. CallCabinet’s Analytics may include up to 4 additional conversation data sources. These include automatic notifications, email, social media, and chat, to accelerate and precisely target a user’s specific business insights derived from captured voice data. CallCabinet’s Analytics also provides the customer with the functionality to customize their dashboards to meet their business requirements.
Before looking at the creating dashboards it would be appropriate to understand the various metrics you can measure and their meaning;
Interactions: In Conversation Analytics, Interactions are the back-and-forth exchanges across audio, email, and chat. These conversations are analyzed to understand things like how happy or frustrated someone is, what they’re trying to ask or solve, and how well the conversation is going. This helps businesses improve their customer service and make conversations smoother.
- Interactions per Workday: Refers to the total number of exchanges between an agent and a customer that take place during a standard 8-hour workday (Monday – Friday).
- Interactions average: The average number of interactions that took place in the selected date range.
- Highest Interactions: Refers to the agent that handled the greatest number of calls within the selected date range.
- Lowest Interactions: Refers to the agent that handled the fewest number of calls within the selected date range.
- Short Calls: The number of calls that were shorter than a defined threshold, which is 60 seconds.
- Distinct Agents for Date Period: This shows the total number of unique agents who handled calls during this period.
- Avg Agents per Workday: This is the average number of agents working on each day within the selected date range. This helps understand staffing levels and potential fluctuations in agent availability. Workday refers to Monday – Friday, i.e., the metric excludes Saturday and Sunday.
- Total Available Time (HH:MM): This represents the total time agents were scheduled to work during this period (8 hours per day, Monday – Friday), summed across all agents for the selected date range.
- Productive Time (HH:MM): This is the total time agents spent actively engaged in calls with customers. This is a key metric for measuring agent productivity and efficiency.
- Unproductive Time (HH:MM): This refers to the time agents were on calls but not actively interacting with customers. This could include time spent on hold, navigating systems, or waiting for information.
- Idle Time (HH:MM): This represents the time agents were not on calls. This could include time spent between calls, on breaks, in meetings, or doing administrative tasks.
Sentiment:
- Agent Sentiment: It looks at how the agent’s words or responses come across — whether they’re friendly, neutral, frustrated, helpful, or anything in between.
- Most Improved: Most Improved refers to the agent who has shown the greatest positive change in sentiment compared to the previous month’s sentiment value. This could indicate that the agent is becoming more confident, friendly, or effective in their communication, leading to improved customer experiences and better overall sentiment in their interactions.
- Most Regressed: Most Regressed refers to the agent whose sentiment has worsened compared to the previous month’s sentiment value, resulting in more negative or less effective interactions. This may suggest issues such as increased frustration, burnout, or communication challenges, which could affect the quality of customer service.
- Negative Engagements: Refers to interactions where the agent’s tone or responses are perceived as frustrated, unhelpful, or disengaged, leading to a negative experience for the customer. These types of interactions can indicate dissatisfaction or tension between the agent and customer, requiring further attention or coaching.
- Positive Engagements: Refers to interactions where the agent’s tone and responses are warm, supportive, and solution-focused, leading to a positive customer experience. These interactions often reflect an agent’s ability to maintain professionalism and empathy, creating a more satisfying experience for the customer.
Caller Sentiment: Refers to the caller’s perspective and is determined by analyzing the language and expressions the caller uses, which can reveal if they are feeling happy, frustrated, confused, angry, or satisfied.
Productive Time: This represents the time agents are actively engaged in calls.
Unproductive Time: Represents periods when agents are on calls but not actively engaging with customers.
- This could include:
Holding for Information: Waiting for a supervisor or accessing customer data.
Internal System Navigation: Using internal tools or software during a call.
Customer Silence: Periods where the customer is silent, perhaps thinking or on hold themselves.
Agent Performance:
- AQA Score: Is an agent’s or a group of agents’ overall score for the selected timeframe, based on the configured QA Scorecards.
- AQA Score MTD: This represents the agent’s average QA score for the current month-to-date. If a single question is selected, this will update to show a value for that specific question.
- AQA Score MoM%: This shows the percentage change in the agent’s QA score compared to the previous month.
- Best AQA: Refers to the agent that scored the highest across all scorecard questions or for a specific question.
- Worst AQA: Refers to the agent that scored the lowest across all scorecard questions or for a specific question.
- Best Question: Indicates the specific questions on the QA scorecard where the agent(s) performed the best.
- Worst Question: Indicates the specific questions on the QA scorecard where the agent(s) performed the worst.
- Best Section: Shows the sections within the QA scorecard where the agent(s) scored the highest.
- Worst Section: Shows the sections within the QA scorecard where the agent(s) scored the lowest.
Customer Experience:
- Customer Confusion: This measures how often customers express confusion or lack of understanding during interactions. A higher score suggests more frequent occurrences of customer confusion.
- Call Backs: This measures how often customers have to call back to address the same issue. Frequent call backs suggest unresolved problems or poor first-call resolution.
- Profanity: This likely measures the occurrence of customers using offensive language during interactions. Higher profanity suggests a higher level of customer frustration or dissatisfaction.
- Escalation: This shows how often calls require escalation to a supervisor or higher authority. Higher escalation rates may point to complex issues or agent challenges in handling difficult situations.
- Transfers: This tracks the frequency of calls being transferred between agents or departments. More transfers can indicate inefficient routing or difficulty in resolving issues.
Interaction Time:
- Total Talk Time: This represents the total duration of active conversations between agents and customers. When viewing aggregated data, it reflects the combined talk time of all agents on a given day.
- Total Hold Time: This measures the total time customers are placed on hold during calls. This metric can highlight potential inefficiencies in call handling or access to information.
- Total Overtalk Time: This indicates instances where simultaneous speaking occurs, either with the agent interrupting the customer or both parties talking over each other. Monitoring this can help improve communication clarity and customer experience.
Business Risks:
- Escalation: A customer issue that requires transfer to a supervisor or specialized team because the first agent is unable to resolve it.
- Cancellations: A customer expresses their intent to discontinue a product, service, or order during the conversation.
- Formal Complaint: A customer actively initiates a formal complaint process regarding their experience with the company.
- Report to Agency: The customer explicitly threatens to involve a regulatory body or consumer protection agency (which varies by region/country) due to their dissatisfaction.
Now that you have an overview of the metrics that may be measured, let us proceed with our discussion on dashboards.
NOTE: Analytics has its own license with bundled call recording, PCI-DSS, etc.

Figure– Enable Analytics View
To access CallCabinet’s Analytics view, the analytics user must click the Analytics tab which appears at the top of CallCabinet’s view, as illustrated by 1 in the Figure – Enable Analytics View. When an analytics user clicks the Analytics tab a page similar to that rendered in Figure – Initial Analytics View is displayed.
The menu that is associated with the Analytics portal is rendered on the left side of the view, as illustrated by 1 in Figure – Initial Analytics View
An analytics user is able to create their own dashboards, each of which may contain up to six visuals. When the analytics user clicks on My Dashboards, as illustrated by 2 in Figure – Analytics Initial View, an Available Dashboards card is rendered as illustrated by 3 in Figure – Analytics Initial View. This card consists of a carousel which contains all dashboards the analytics user has created and may select. The analytics user is able to navigate from one dashboard slide to another by clicking the navigation icons,
![]() and
and ![]() . If a dashboard in the carousel is selected, it is then displayed with all its visuals. This is illustrated by 4 in Figure – Analytics Initial View. By default there will be an “Overview Dashboard” available in the analytics user’s dashboard.
. If a dashboard in the carousel is selected, it is then displayed with all its visuals. This is illustrated by 4 in Figure – Analytics Initial View. By default there will be an “Overview Dashboard” available in the analytics user’s dashboard.

Figure – Analytics Initial View
For an analytics user to create a dashboard, they click the Manage Dashboards button, illustrated by 5 in Figure – Analytics Initial View. The very first time the analytics user accesses this view, it will contain a single pre-created default dashboard, and look similar to Figure – Initial Manage Dashboard. However, after the analytics user creates further dashboards containing visuals the view will look similar to Figure – Manage Dashboards.
NOTE: Each analytics user is able to create dashboards. The dashboards they create are applicable to them alone. This therefore implies that each analytics user in a customer’s account may have their own set of personalized, customized dashboards and associated visuals.

Figure – Initial Manage Dashboard

Figure – Manage Dashboards
There are two ways in which an analytics user may add a dashboard to their My Dashboards view. The first way is to select a preconfigured template. These are located in the Dashboard Templates tab (illustrated by 2 in Figure – Dashboard Templates) that is made clickable when the analytics user clicks Manage Dashboards (illustrated by 1 in Figure – Dashboard Templates). Figure – Dashboard Templates is an example of this view containing all possible templates, illustrated by 3 an analytics user may choose. The displayed templates may be filtered by clicking the tags as illustrated by 4 in Figure – Dashboard Templates.

Figure – Dashboard Templates
The current templates available are:
- Overview Dashboard
- Agents Dashboard
- Agents Performance Dashboard
- Interactions Dashboard
- Interactions Journey Dashboard
- Customer Experience Dashboard
- Business Risk Dashboard
- Customer Satisfaction Dashboard
- CX Self Service Dashboard
- Phrase Hit Analysis Dashboard
Should an analytics user wish to make use of one of the templates and attach it to their My Dashboards page, they would click the desired template. The selected dashboard will then be added to the My Configured Dashboards’ view, and the analytics user will be automatically navigated to this view. For instance, clicking on the Interaction Dashboard template will result in a view similar to that in Figure – Selected Template being rendered.

Figure – Selected Template
The analytics user may go ahead and change the dashboard and its visuals illustrated by 2 in Figure – Selected Template to meet their needs using this template as a basis, or they can merely save it by clicking the Save Dashboard button, as illustrated by 1 in by Figure – Selected Template. Doing so adds the dashboard and its associated visuals to their My Dashboards view. Editing the dashboard is described further on in this document where creating a dashboard is discussed. If the analytics user does not want to edit or save the selected template, they would click the Close Editor button as illustrated by 3 in by Figure – Selected Template. Should the analytics user click on My Dashboards, they should see their newly added dashboard.
Before discussing the second way in which an analytics user may create a dashboard, let us discuss the purpose and features of each of the above-mentioned dashboard templates.
-
- Overview Dashboard
The main goal of the Overview Dashboard is to provide key insights into Conversation Analytics. The dashboard serves as a central hub for viewing important KPIs related to Conversation Analytics and aims to offer a high-level summary of performance and key operational metrics, such as Agent Performance and Call Handling Statistics.
The Overview Dashboard consolidates various metrics like Call Interactions, Automated Quality Assurance (AQA) Scorecard Performance, Overtalk, Silence, and various other statistics into a single, easy-to-navigate view. The aim is to facilitate quick decision-making by providing easy-to-read visuals that highlight areas that need attention or improvement and allowing managers and decision-makers to identify trends, outliers, and opportunities for training or operational improvement.
The purpose of each visual in this dashboard is;- Overview KPI Card: Provides an at-a-glance summary of key metrics – Interactions, Agent Sentiment, and Caller Sentiment. This enables analytics users to compare metrics against Month to Date (MTD), Previous Month (Prev Month), and the change from one month to the next (MoM Change).
- Interactions: In Conversation Analytics, Interactions are the back-and-forth exchanges across audio, email, and chat. These conversations are analyzed to understand things like how happy or frustrated someone is, what they’re trying to ask or solve, and how well the conversation is going. This helps businesses improve their customer service and make conversations smoother.
- Agent Sentiment: It looks at how the agent’s words or responses come across — whether they’re friendly, neutral, frustrated, helpful, or anything in between.
- Caller Sentiment: Refers to the caller’s perspective and is determined by analyzing the language and expressions the caller uses, which can reveal if they are feeling happy, frustrated, confused, angry, or satisfied.

- Interactions by Agent Group Bar Chart: This visual allows for the easy comparison of interaction volumes across different Agent Groups. Analytics users can quickly see which Agent Groups are handling more interactions. By visualizing the data in this way, analytics users can identify which Agent Groups are more efficient or effective based on the number of interactions they manage. This can help in assessing workload distribution and performance metrics

- Selected Metric Value by Date with Forecasting Trend Line Chart: Using the KPI Parameter Filter will allow an analytics user to see how various KPI Parameters change over a specified date range. This can help identify patterns, seasonality, or long-term trends. This can also be helpful in identifying areas needing improvement.

- AQA Score by Date and Scorecard Trend Line Chart: This visual compares AQA (Automatic Quality Assurance) Scores per Scorecard across different dates, allowing analytics users to monitor changes in AQA scores for each scorecard, assessing how quality assessments evolve and determining the effectiveness of training or process improvements. The chart enables the identification of consistent trends or anomalies in AQA scores across different scorecards, highlighting areas of concern or improvement within interactions.

To allow analytics users to easily navigate from high-level insights to detailed analysis, the Overview Dashboard flow is as follows. Starting with the KPI Card – the purpose is to provide a high-level view of key metrics and indicate metrics needing deeper analysis. For example, if metrics decrease month-on-month, it signals a need for further investigation.
Interactions by Agent Group then displays the number of interactions per Agent Group. Clicking on a specific Agent Group filters the KPI card and other visuals on the dashboard to focus on that Agent Group, helping identify which Agent Group’s performance is impacting the month-on-month metric changes.
Next the KPI Parameter Filtered by Date visual shows trends of selected metrics over a specified date range. When an Agent Group is selected, this visual shows the trend for that specific Agent group, highlighting increases and decreases in metrics.
The AQA Scorecard Scores visuals allows users to compare AQA scores against KPI parameters. Low scores on certain days can be analyzed in context, e.g., correlating high interaction spikes or short call durations. Selecting an Agent Group will visualize the scorecard scores for that Agent Group over the same date period.
By allowing users to interact with the dashboard in this way, the tool provides a flexible, real-time approach to monitoring and improving customer interactions. It empowers users to dive into specific areas, identify patterns, and respond proactively to issues, enhancing decision-making, training, and overall performance.
- Agents Dashboard
The main goal of the Agents Dashboard is to provide key insights into Conversation Analytics for specific Agents. It aims to offer a high-level summary of performance- and key operational metrics (such as Agent Performance and Call Handling Statistics) with the ability to easily select an Agent and assess the statistics for the selected Agent.- Agent KPI Card: Provides an at-a-glance summary of Agent Sentiment, the Agents that have improved and regressed the most, Positive Engagements, and Negative Engagements, as well as a summary of the Interactions. This specifically looks at Interactions per Words, Interactions per Agent, Highest number of Interactions by an Agent, and Lowest number of Interactions by an Agent. The KPI card provides an immediate overview of each Agent’s performance metrics, allowing managers and stakeholders to quickly assess how individual Agents are performing in terms of sentiment and engagement.

- Interactions per Workday: Refers to the total number of exchanges between an agent and a customer that take place during a standard 8-hour workday (Monday – Friday).
- Interactions average: The average number of interactions that took place in the selected date range.
- Highest Interactions: Refers to the agent that handled the greatest number of calls within the selected date range.
- Lowest Interactions: Refers to the agent that handled the fewest number of calls within the selected date range.
- Agent Sentiment: Refers to the emotional tone or attitude of an agent during a conversation.
- Most Improved: Most Improved refers to the agent who has shown the greatest positive change in sentiment compared to the previous month’s sentiment value. This could indicate that the agent is becoming more confident, friendly, or effective in their communication, leading to improved customer experiences and better overall sentiment in their interactions.
- Most Regressed: Most Regressed refers to the agent whose sentiment has worsened compared to the previous month’s sentiment value, resulting in more negative or less effective interactions. This may suggest issues such as increased frustration, burnout, or communication challenges, which could affect the quality of customer service.
- Negative Engagements: Refers to interactions where the agent’s tone or responses are perceived as frustrated, unhelpful, or disengaged, leading to a negative experience for the customer. These types of interactions can indicate dissatisfaction or tension between the agent and customer, requiring further attention or coaching.
- Positive Engagements: Refers to interactions where the agent’s tone and responses are warm, supportive, and solution-focused, leading to a positive customer experience. These interactions often reflect an agent’s ability to maintain professionalism and empathy, creating a more satisfying experience for the customer.
- Interactions by Agent Bar with drilldown for Audio Duration Bins and Audio Duration (Mins): This visual allows for the straightforward comparison of the number of interactions handled by each Agent. This helps identify high-performing Agents as well as those who may need additional support or training. By visualizing interactions over time, managers can spot trends in individual Agent performance, such as consistent increases or decreases in interactions, which can indicate changes in efficiency or engagement. Drilling down on specific Agents allows analytics users to see additional information regarding the average audio duration across their interactions.

- Interactions and Agent Sentiment by Date: Allows analytics users to compare different categories or groups. The added sentiment line shows how the sentiment changes over time, which allows for the identification of trends.

- Productive Time Split Chart: This chart provides a clear overview of how each Agent spends their time each 8-hour work day. By comparing the segments of Productive vs. Unproductive Time, managers can quickly identify which Agents are maximizing their productive time and which may be spending too much time in non-productive activities. Agents with a high proportion of productive talk time compared to unproductive time can be recognized as more efficient, while those with higher idle or unproductive time may need support or training.

- Productive Time: This represents the time agents are actively engaged in calls.
- Unproductive Time: Represents periods when agents are on calls but not actively engaging with customers. This could include:
Holding for Information: Waiting for a supervisor or accessing customer data.
Internal System Navigation: Using internal tools or software during a call.
Customer Silence: Periods where the customer is silent, perhaps thinking or on hold themselves.
Idle Time: Represents any time agents spend not actively on calls.The Agents Dashboard‘s flow enables users to effectively analyze individual Agent performance, identify trends, and make data-driven decisions to enhance productivity and scheduling in conversation analytics.
The KPI Card provides a high-level overview of key performance metrics, which highlights metrics needing further analysis, e.g., a month-on-month decrease prompts investigation into underlying causes.
Moving to Interactions by Agent – this chart displays the number of interactions for each Agent. Clicking on a specific Agent filters the KPI card and other visuals, allowing for targeted analysis of that Agent’s metrics, helping to identify who may be affecting overall performance.
Then the aggregated Interactions and Agent Sentiment chart shows daily totals of interactions and sentiment for all Agents. Selecting an Agent visualizes their specific interactions and sentiment for the selected date period. A drill-down feature provides hourly data, helping to identify patterns such as call volume spikes during lunch and corresponding low sentiment, indicating potential staffing issues.
The last visual on this dashboard, the Productive Time Split chart, illustrates how Agents utilize their time during an 8-hour workday. Selecting a specific Agent will update the metrics to show a breakdown of that Agent’s time spent on calls (Productive/Talk Time), Unproductive Time (Silence/Hold Time), and Idle time.
- Agent KPI Card: Provides an at-a-glance summary of Agent Sentiment, the Agents that have improved and regressed the most, Positive Engagements, and Negative Engagements, as well as a summary of the Interactions. This specifically looks at Interactions per Words, Interactions per Agent, Highest number of Interactions by an Agent, and Lowest number of Interactions by an Agent. The KPI card provides an immediate overview of each Agent’s performance metrics, allowing managers and stakeholders to quickly assess how individual Agents are performing in terms of sentiment and engagement.
- Agent Performance Dashboard
The aim of the Agent Performance Dashboard is to provide a detailed overview of the AQA (Automated Quality Assurance) Scores for each Agent, enabling managers and stakeholders to assess individual performance effectively. The dashboard not only displays overall scores but also breaks down the results by specific questions and sections, allowing for a clear understanding of strengths and areas for improvement. Furthermore, the dashboard features an interactive trend analysis component. When a specific Agent is selected, analytics users can visualize their performance trends over time. This functionality allows for easy identification of patterns, such as improvements or declines in scores, correlating with changes in training, process adjustments, or other operational factors.- AQA Score by Section and Question Table: This visual serves as a quick overview of the overall AQA performance across various aspects of the interaction. It helps identify areas where Agents may need further training or coaching to improve their performance and ensure customer satisfaction.

- Agent Performance KPI Card: This KPI Card provides a quick snapshot of Agent performance, focusing on their Quality Assurance (QA) scores. It helps to identify areas where the Agent excels and where they may need improvement. Specific metrics focused on in this KPI Card include the overall AQA Score, AQA Score MTD, AQA Score MoM %, Best AQA, Worst AQA, Worst Question, Best Section, Best Question, and Worst Section. The overall AQA score indicates the overall quality of Agent Performance whereas some of the other metrics highlight the Agent with the best AQA score and the Agent with the worst AQA score. Supervisors can use this KPI Card to identify specific areas where an Agent needs improvement and tailor their coaching sessions accordingly.

- AQA Score: This is an agent’s or a group of agents’ overall score for the selected timeframe, based on the configured QA Scorecards.
- AQA Score MTD: This represents the agent’s average QA score for the current month-to-date. If a single question is selected, this will update to show a value for that specific question.
- AQA Score MoM%: This shows the percentage change in the agent’s QA score compared to the previous month. In this case, the score has decreased by 3.06%.
- Best AQA: Refers to the agent that scored the highest across all scorecard questions or for a specific question.
- Worst AQA: Refers to the agent that scored the lowest across all scorecard questions or for a specific question.
- Best Question: Indicates the specific questions on the QA scorecard where the agent(s) performed the best.
- Worst Question: Indicates the specific questions on the QA scorecard where the agent(s) performed the worst.
- Best Section: Shows the sections within the QA scorecard where the agent(s) scored the highest.
- Worst Section: Shows the sections within the QA scorecard where the agent(s) scored the lowest.
- AQA Score by Agent Bar Chart: Provides a clear visual comparison of AQA (Automated Quality Assurance) scores across different Agents. This helps identify high performers and those who may need additional support or training. Additionally, this chart can reveal patterns in performance over time, allowing managers to track improvements or declines in quality scores for individual Agents.

- AQA Score by Date with Forecasting Chart: Allows stakeholders to monitor changes in AQA scores across specific dates, helping to identify trends in Agent performance over time. The chart can reveal patterns, such as seasonal fluctuations or recurring issues, indicating when performance may dip or improve, which can be crucial for planning and resource allocation. If any changes are made, e.g., new training programs or process adjustments, the trend line chart can help assess their effectiveness by comparing scores before and after the implementation.

- Interactions and Caller Sentiment by Date (with Drilldown for Hour of Day) Chart: The combined display of interaction volume and sentiment allows for the analysis of whether changes in interaction volume directly impact customer sentiment. For instance, a sudden spike in interactions might be associated with a decrease in sentiment, suggesting that agents are struggling to keep up with demand. The added drilldown functionality offers a more granular view of the number of interactions at specific hours of the day along with the corresponding Caller Sentiment.

- Productive Time Split Chart: This chart provides a clear overview of how each Agent spends their time each day. By comparing the segments of Productive vs. Unproductive Time, managers can quickly identify which Agents are maximizing their productive time and which may be spending too much time in non-productive activities. Agents with a high proportion of productive talk time compared to unproductive time can be recognized as more efficient, while those with higher idle or unproductive time may need support or training.

Productive Time: This represents the time agents are actively engaged in calls.
Unproductive Time: Represents periods when agents are on calls but not actively engaging with customers. This could include:
Holding for Information: Waiting for a supervisor or accessing customer data.
Internal System Navigation: Using internal tools or software during a call.
Customer Silence: Periods where the customer is silent, perhaps thinking or on hold themselves.
Idle Time: Represents any time agents spend not actively on calls.The Agent Performance Dashboard provides a comprehensive and dynamic view of Agent quality and efficiency, allowing managers to easily monitor performance and identify areas for improvement. By selecting a specific Agent, the dashboard updates to display tailored metrics relevant to that individual, ensuring focused insights.
The AQA scores across different sections and questions offer a detailed breakdown of the Agent’s performance in various areas. This allows managers to pinpoint specific strengths and weaknesses, helping to identify where further training or coaching might be needed. The table provides a quick snapshot of the overall quality of interactions, as well as more granular insights into individual aspects of the conversation.
For a more focused look at performance, the KPI card highlights critical metrics such as the overall AQA score, MTD and MoM percentage changes, as well as the best and worst AQA scores. Selecting an Agent updates the card to reflect their specific performance, showcasing both areas of excellence, such as the best question or section, and areas for improvement, such as the worst question or section. This enables supervisors to tailor coaching efforts based on the individual’s strengths and areas where they may be struggling.
The bar chart offers a side-by-side comparison of AQA scores across all Agents, making it easy to see where the selected Agent stands relative to others. It can also track performance trends over time, helping managers identify consistent top performers or those needing additional support.
To better understand performance over time, the trend line chart tracks AQA scores by date, highlighting any fluctuations or seasonal trends. Selecting an Agent updates the chart to show their individual score trends, helping managers assess whether changes in performance are due to external factors or internal adjustments, such as new training programs or process changes.
The interactions and caller sentiment chart allows managers to explore the relationship between interaction volume and customer sentiment. By drilling down to specific hours of the day, this visual helps identify if high volumes of interactions are impacting sentiment negatively. The updated view for a specific Agent allows managers to see whether an increase in workload correlates with a decline in sentiment for that individual.
Finally, the productive time chart displays how the selected Agent spends their time throughout the day, distinguishing between productive and unproductive time. This allows managers to quickly identify areas where the Agent could improve efficiency and focus more on productive tasks, providing a clear basis for coaching and performance optimization. It is important to understand how the data in this visualization is aggregated and how it can be filtered for more granular analysis. The metrics shown (Productive Time, Unproductive Time, and Idle Time) represent the combined activity of all agents on a given day. This means that for any selected date:
Total Time: The sum of all three metrics will equal 8 hours multiplied by the number of agents working that day.
Agent Filtering: You can filter the data to analyze the performance of individual agents. When a single agent is selected, the metrics will reflect only that agent’s activity, totaling 8 hours for their workday (Monday – Friday). This functionality allows for both high-level overview of team performance and detailed analysis of individual agent activity.Together, these visuals form a dynamic, easy-to-navigate dashboard that allows supervisors to monitor and improve Agent performance with data-driven insights tailored to each individual.
- AQA Score by Section and Question Table: This visual serves as a quick overview of the overall AQA performance across various aspects of the interaction. It helps identify areas where Agents may need further training or coaching to improve their performance and ensure customer satisfaction.
- Interactions Dashboard
The Interactions Dashboard allows analytics users to view a comprehensive summary of customer interactions over a specific time period, enabling them to identify and analyze trends related to spikes in interaction volume. Analytics users can drill down into specific timeframes to uncover patterns in interaction frequency, which can highlight periods of increased customer inquiries or concerns.- Interactions KPI Card: This KPI Card provides a quick overview of all interaction metrics. It helps to assess Agent productivity, engagement quality, and overall effectiveness. The KPI Card highlights the total number of Interactions, the number of Short Calls, Positive Engagements, Negative Engagements, Productive Time, Unproductive Time, and showcases other metrics such as Overtalk and Silence that can be used to identify areas where training is required.

Interactions: Shows the total number of interactions within the selected date range.
Short Calls: The number of calls that were shorter than a defined threshold, which is 60 seconds.
Distinct Agents for Date Period: This shows the total number of unique agents who handled calls during this period.
Avg Agents per Workday: This is the average number of agents working on each day within the selected date range. This helps understand staffing levels and potential fluctuations in agent availability. Workday refers to Monday – Friday, i.e., the metric excludes Saturday and Sunday.
Total Available Time (HH:MM): This represents the total time agents were scheduled to work during this period (8 hours per day, Monday – Friday), summed across all agents for the selected date range.
Productive Time (HH:MM): This is the total time agents spend actively engaged in calls with customers. This is a key metric for measuring agent productivity and efficiency.
Unproductive Time (HH:MM): This refers to the time agents were on calls but not actively interacting with customers. This could include time spent on hold, navigating systems, or waiting for information.
Idle Time (HH:MM): This represents the time agents were not on calls. This could include time spent between calls, on breaks, in meetings, or doing administrative tasks. - Interactions by Date Graph: The trend graph allows analytics users to visualize how interactions change over time. This can help identify patterns, such as peak interaction periods as well as sudden shifts in interactions. By adding forecasting, it helps analytics users anticipate future customer behaviors and trends based on historical data, allowing for better planning and decision-making.

- Agent Sentiment and Caller Sentiment by Month and Day of Month Graph: Allows analytics users to visualize how Agent and Caller sentiment change over time. This can help identify patterns, such as seasonal trends in customer sentiment as well as sudden shifts in sentiment.

- Interactions by Topic Column Chart: This chart allows analytic users to easily compare the frequency or volume of different topics within conversations. This helps identify which issues are most prevalent and which may require more attention. By visualizing how topics change over time, organizations can spot emerging trends, such as rising customer concerns or shifting interests.

- Interactions by Audio Duration Bin with drilldown for Audio Duration Minutes Chart: By plotting audio duration over time, teams can analyze trends in call length on a per Agent basis. This can reveal patterns, such as whether calls are getting longer due to increased complexity or shorter due to improved efficiency.

- Call Listing Table: Table displaying all the calls in the selected time period. Metrics shown in this table include Audio Duration, Agent, AQA Score, Silence, Overtalk, Agent Sentiment, and Caller Sentiment. Analytics users are able to select a specific call which will update all other metrics on the dashboard.
 The Interactions Dashboard provides a comprehensive and dynamic view of customer interactions, allowing analytic users to monitor key metrics, analyze trends, and make data-driven decisions. When analytic users interact with various visuals on the dashboard, the data updates in real time, providing tailored insights based on their selections.
 The KPI Card offers a quick snapshot of overall interaction metrics such as total interactions, short calls, positive and negative engagements, productive and unproductive time, overtalk, and silence.
The Interactions by Date graph visualizes how interactions evolve over time and includes forecasting to predict future trends. If an analytic user clicks on a specific date range or a peak interaction period in the graph, the rest of the dashboard will update to reflect data for that selected timeframe. For example, selecting a spike in interactions will update other metrics, like sentiment, agent performance, or topic frequency, to show how those elements were affected. This allows analytic users to see how shifts in interaction volume correlate with other key metrics, helping to better understand patterns and plan for future periods.
The sentiment trend graph tracks how both Agent and Caller Sentiment change over time. If an analytic user clicks on a specific dip or peak in sentiment, the dashboard updates to show detailed insights related to that period. For instance, selecting a drop in sentiment might trigger updates that show how specific topics, agents, or customer concerns influenced the shift. This enables managers to identify patterns in sentiment and take action to address issues or capitalize on positive changes.
The chart showing Interactions by Topic allows analytic users to see the frequency of different topics within interactions. Clicking on a specific topic, such as “Billing Issues,” filters the dashboard to focus on interactions related to that issue. Other visuals will update to reflect the data for that selected topic, showing how it compares in terms of sentiment, call duration, and agent performance. This helps identify prevalent concerns, emerging trends, or areas requiring more attention and support.
The Audio Duration Bin chart tracks call length over time. By drilling down into a specific duration bin, such as calls lasting 5-10 minutes, the dashboard updates to show data specific to that call length. Analytic users can analyze which Agents are handling these calls, whether the calls are longer due to increased complexity or shorter due to improved efficiency, and how other metrics such as overtalk or silence are affected. This helps teams understand if changes in call duration are tied to performance trends or process efficiencies.
Finally, the Call Listing table displays all interactions within the selected time period. When an analytic user selects a specific call from the table, all the other visuals on the dashboard update to show detailed data for that interaction. For example, selecting a call with low sentiment may trigger updates in the sentiment graphs, showing how it impacted the Agent and Caller experience. The analytic user can also drill down into metrics like the AQA score or Audio Duration to better understand the factors that contributed to the call’s outcome.
By allowing analytic users to interact with the dashboard in this way, the tool provides a flexible, real-time approach to monitoring and improving customer interactions. It empowers users to dive into specific areas, identify patterns, and respond proactively to issues, enhancing decision-making, training, and overall performance.
- Interactions KPI Card: This KPI Card provides a quick overview of all interaction metrics. It helps to assess Agent productivity, engagement quality, and overall effectiveness. The KPI Card highlights the total number of Interactions, the number of Short Calls, Positive Engagements, Negative Engagements, Productive Time, Unproductive Time, and showcases other metrics such as Overtalk and Silence that can be used to identify areas where training is required.
- Interactions Journey Dashboard
The Interactions Journey Dashboard provides a comprehensive view of customer call interactions, empowering Agent Groups to enhance service quality and optimize performance. Featuring a Call Listing Table, AQA Scorecard, and Chat With Data. The dashboard enables users to analyze key metrics such as call length, sentiment, and AQA scores. By allowing users to drill down into specific calls, the dashboard reveals valuable insights into Agent performance, customer sentiment, and common inquiry trends. This data-driven approach facilitates informed decision-making, targeted training, and continuous improvement in customer support operations, ultimately driving better customer experiences and outcomes.- Chat With Data: Allows users to run a query on the selected call and gain additional context and information based on AI findings.

- Call Listing Table: Table displaying all the calls in the selected time period. Metrics shown in this table include Call Length, AQA Score, Agent, Audio Duration, Silence, Overtalk, Agent Sentiment, and Caller Sentiment. Analytics users are able to select a specific call which will update all other metrics on the dashboard.
- AQA Score by Section and Question: This visual serves as a quick overview of the overall AQA performance across various aspects of the interaction. It helps identify areas where Agents may need further training or coaching to improve their performance and ensure customer satisfaction.The Interactions Journey Dashboard is designed with an intuitive flow that allows users to seamlessly explore call data, uncover insights, and make informed decisions based on detailed analysis. The journey begins with the Call Listing Table, which provides a sortable and filterable list of all calls from the selected time period. Analytics users can click on a specific call, and all visuals will update to display metrics related to that particular interaction.
Once a call is selected, the AQA Score by Section and Question visual updates to show the overall AQA score for the selected call, along with a detailed breakdown of scores for each question. This breakdown allows analytics users to analyze how the AQA score aligns with other metrics, providing a clear understanding of the Agent’s performance during that call.
In addition to these visuals, analytics users can further explore the selected interaction through the Chat with Data feature. By inputting specific queries, analytics users can leverage AI-driven insights to uncover patterns or gather additional context about the call, enabling a deeper understanding of the factors influencing performance and customer sentiment. Analytics users are also able to leverage this feature to ask for action steps or follow-up activities that need to be performed after the conclusion of the call.
This seamless flow enables analytics users to move from a high-level overview to detailed call-specific insights, facilitating a comprehensive analysis of each interaction.
- Chat With Data: Allows users to run a query on the selected call and gain additional context and information based on AI findings.
- Customer Experience Dashboard
The Customer Experience Dashboard offers a holistic view of customer interactions, leveraging conversation analytics to assess the quality and effectiveness of communication. It highlights key metrics such as sentiment analysis and call outcomes, enabling organizations to gauge overall satisfaction and engagement. By tracking trends in Agent performance and identifying recurring themes in customer inquiries, the dashboard empowers stakeholders to make data-driven decisions that enhance service delivery. Ultimately, this dashboard serves as a vital tool for improving customer experiences, fostering loyalty, and driving continuous improvement across all interactions.- Customer Experience Score Chart: Radar charts allow for the representation of multiple dimensions of customer experience, as it relates to soft skills, simultaneously. Each axis represents different aspects of AQA (Automated Quality Assurance) scores. This chart clearly shows imbalances in performance across different criteria, helping teams focus on specific areas for development.

- Agent Sentiment and Caller Sentiment by Audio Duration Bin Chart: By comparing Caller Sentiment (how customers feel) with Agent Sentiment (how Agents perceive the interaction), the radar chart can reveal discrepancies. This dual perspective is essential for understanding the overall tone of conversations. For example, if a caller expresses frustration while an Agent feels positive, it may indicate a misalignment that needs addressing. Over time, the radar chart can help users track changes in sentiment, helping organizations gauge the effectiveness of training, process changes, or new initiatives aimed at improving customer experience.

- Customer Experience Score Issues by Date Chart: The stacked column chart visually represents the count of each issue type on a given date. By hovering over a specific column, users can gain detailed insights into the composition of issues for that particular day. The visual helps identify periods with a high volume of customer issues, allowing for targeted analysis and intervention. It can reveal potential correlations between different issue types. For example, an increase in escalations might be linked to a rise in customer confusion. By comparing data before and after implementing changes, the dashboard can assess their impact on customer experience.

- Interactions Time Breakdown by Date Chart: Using a stacked column chart allows for easy comparison of these three metrics (Total Talk Time vs Total Hold Time vs Total Overtalk Time) side by side. The data is aggregated across all agents by default, but can be filtered to display individual agent activity. Stakeholders can quickly assess how each time metric relates to the others, helping identify patterns or discrepancies. Over time, the chart can highlight trends in customer interactions. For example, if hold time is increasing while talk time decreases, it may indicate inefficiencies in the support process. Additionally, by visualizing these metrics, the chart can help monitor the performance of customer service representatives and overall service efficiency, facilitating targeted training or process improvements.

Total Talk Time: This represents the total duration of active conversations between agents and customers. When viewing aggregated data, it reflects the combined talk time of all agents on a given day.
Total Hold Time: This measures the total time customers are placed on hold during calls. This metric can highlight potential inefficiencies in call handling or access to information.
Total Overtalk Time: This indicates instances where simultaneous speaking occurs, either with the agent interrupting the customer or both parties talking over each other. Monitoring this can help improve communication clarity and customer experience.The Customer Experience Dashboard flow provides a comprehensive overview of customer experience and Agent performance metrics. It combines soft skill assessments with operational insights, allowing analytics users to identify training needs, analyze sentiment discrepancies, and evaluate productivity across interactions.
Starting with the Customer Experience Performance radar chart, this visual focuses on Customer Confusion, Call Backs, Profanity, Escalation, and Transfers. The ‘Topics’ in the Customer Experience Score visual are currently static, meaning analytics users are unable to modify them.
Next, the Agent Sentiment vs. Caller Sentiment by Audio Duration Bins radar chart reveals discrepancies in sentiment between Agents and Callers across different call durations. This visual highlights instances where Agent Sentiment is significantly lower than Caller Sentiment, indicating areas where additional training may be necessary.
Following that, the Issue Ranking by Date Time chart is designed to pinpoint specific days and interactions where certain topics are most frequently addressed. This visual allows users to track how various issues evolve over time and analyze the context of those calls.
Finally, the Interactions Time Breakdown by Date graph shifts the focus to operational metrics. This chart compares Hold Time with overall Talk Time and Overtalk Time, enabling users to assess system efficiency and determine whether Agents require further training. It provides insights into Agent productivity on specific workdays.
- Customer Experience Score Chart: Radar charts allow for the representation of multiple dimensions of customer experience, as it relates to soft skills, simultaneously. Each axis represents different aspects of AQA (Automated Quality Assurance) scores. This chart clearly shows imbalances in performance across different criteria, helping teams focus on specific areas for development.
- Business Risk Dashboard
The Business Risk Dashboard provides a comprehensive view of conversation analytics, focusing on the identification and fluctuation of key issues/risks over time. By visualizing the frequency and impact of specific issues on different days, the dashboard allows stakeholders to track trends and patterns in customer interactions. Additionally, it analyzes how these issues affect both Agent- and Caller Sentiment, highlighting correlations that can inform strategic decision-making. This integrated approach empowers organizations to proactively address risks, enhance customer experience, and improve Agent performance.- Business Risk Rates KPI Cards: Provides an at-a-glance summary of key issues/risks, which allows users to view the Month to Date (MTD) metrics, view metrics from the Previous Month (Prev Month), and see the Month on Month (MoM) Change.


Escalation: A customer issue that requires transfer to a supervisor or specialized team because the first agent is unable to resolve it.
Cancellations: A customer expresses their intent to discontinue a product, service, or order during the conversation.
Formal Complaint: A customer actively initiates a formal complaint process regarding their experience with the company.
Legal Mention: The customer brings up legal action, regulations, or their legal rights during the interaction.
Report to Agency: The customer explicitly threatens to involve a regulatory body or consumer protection agency (which varies by region/country) due to their dissatisfaction. - Business Risk Rate by Date Chart: This trend line chart provides a holistic view of how these Business Risks increased or decreased over time. This allows users to view various rates and compare for the entire year or drill down to specific dates.

- Interactions by Business Risk and Sentiment (with Drilldown for Agent) Chart: This column chart displays the frequency or severity of various business risks identified in conversations. The line chart displays Agent Sentiment and Caller Sentiment. Overlaying sentiment data on the column chart provides context. It allows stakeholders to observe patterns, such as whether negative sentiment increases in response to specific issues, which can inform strategies for improvement. Together, these charts create a comprehensive view of the conversation analytics, helping stakeholders identify not just what issues are present, but also how they impact sentiment. Identifying trends in sentiment and business risks at the Agent level can highlight areas where specific Agents may need additional training or support. This can further reveal which Agents handle business risks more effectively or demonstrate higher levels of sentiment during conversations.

- Business Risk Call Listing Table: This table shows all calls that occurred during the selected time period and gives users the ability to view a specific call when clicking on the Call Link icon. The table also displays the number of Business Risk Issues that were mentioned on each call, as well as the duration of the call and Agent who handled the call.
 This structured flow ensures that analytics users can effectively navigate the Business Risk Dashboard, leveraging its features to maximize understanding and drive strategic actions.
 Analytics users begin by reviewing the Business Risk Rates KPI cards, which provide essential Month to Date (MTD), Previous Month (Prev Month), and Month on Month (MoM) change metrics. This quick summary helps analytics users identify immediate concerns or areas needing attention, setting the context for deeper analysis.
Analytics users then navigate to the Business Risk Rate by Date chart to visualize how business risks have fluctuated over time. This visual allows analytics users to compare various rates for the entire year or drill down to specific dates, allowing them to identify patterns or anomalies in risk levels.
Next, analytics users examine the Interactions by Business Risk and Sentiment chart, which combines the frequency/severity of identified business risks with Agent and Caller Sentiment data. The drill down feature allows analytics users to analyze individual Agent performance, helping identify those who effectively manage risks or require further training based on sentiment trends.
Finally, analytics users access the Call Listing table, which displays all calls that occurred during the selected time period. Analytics users can click on the Call Link icon to view specific calls and see the number of business risks mentioned, enabling the granular analysis of individual interactions. This table serves as a resource for analytics users to investigate particular calls related to high-risk issues, facilitating follow-up actions or discussions.
- Business Risk Rates KPI Cards: Provides an at-a-glance summary of key issues/risks, which allows users to view the Month to Date (MTD) metrics, view metrics from the Previous Month (Prev Month), and see the Month on Month (MoM) Change.
- Customer Satisfaction Dashboard
The Customer Satisfaction Dashboard provides a comprehensive view of customer sentiment regarding a company’s products or services, with the primary goal of helping organizations monitor and improve customer experiences. It aggregates key metrics to assess customer satisfaction, including:- Customer Satisfaction Score (CSAT): Measures overall customer satisfaction with specific interactions or products.
- Net Promoter Score (NPS): Evaluates customer loyalty and their likelihood of recommending the company to others.
- Customer Effort Score (CES): Determines the level of effort required by customers to resolve issues or complete tasks
By visualizing these metrics over time, the dashboard enables the identification of trends and highlights areas that may need attention. It also allows for deeper analysis by customer segment, product category, or geographic region, making it easier to pinpoint opportunities for improvement and ensure a better customer experience.The Customer Satisfaction Score (CSAT) quantifies the level of satisfaction a customer expresses regarding a specific interaction, product, or service. CSAT is calculated based on a specific topic in the CallCabinet portal that addresses the question: “How would you rate your satisfaction with us?” Responses are commonly captured using a numerical rating scale – in this case a 5-point scale ranging from 1 (“Very Dissatisfied”) to 5 (“Very Satisfied”). The system analyzes customer responses by identifying pre-defined phrases within standardized phrase packs. These phrases are associated with distinct satisfaction levels and contribute to the CSAT score based on their assigned weighting. Examples include:
Very Satisfied (Score 5), For example “exceptionally good service ~4”
Satisfied (Score 4), For example “satisfied results ~3”
Neutral (Score 3), For example “bland service ~3”
Dissatisfied (Score 2), For example “insufficient standards ~3”
Very Dissatisfied (Score 1), For example “deeply regret using ~4”
Each response category is scored based on what is found in the call transcript.Calculation:
CSAT = ((CSAT Very Satisfied Calls x 5) + (CSAT Satisfied Calls x 4) + (CSAT Neutral Calls x 3) + (CSAT Dissatisfied Calls x 2) + (CSAT Very Dissatisfied Calls x 1)) / Total Number of ResponsesThe “Total Number of Responses” refers to the number of calls in which any of the phrases for CSAT are picked up. When none of the phrases are picked up, that call is ignored.
CSAT is most effectively employed to gauge satisfaction with specific, transactional interactions such as post-support ticket resolution, immediately after a purchase, or following an onboarding process. Timely deployment of CSAT surveys is crucial to capture accurate feedback related to the specific event.
Customer Satisfaction Score Benchmark (CSAT)
Rating Category Score Range Interpretation Good Above 70% Strong to exceptional customer satisfaction Average 60% to 70% Industry standard performance Poor Below 60% Improvement needed Industry Average 60% to 70% Benchmark across all industries In highly competitive industries like SaaS, benchmarks tend to be higher, with good scores typically above 70%.
The Net Promoter Score (NPS) is a key metric used to gauge customer loyalty and advocacy by assessing the likelihood of customers recommending a business, product, or service to others. Net Promoter Score (NPS) is calculated based on customer responses to the fundamental question: “How likely are you to recommend us?” In the CallCabinet portal, each of these NPS categories is established as a distinct topic. Phrase packs are then linked to these topics to identify relevant customer feedback within conversations.
Responses are commonly captured using a numerical rating scale – in this case a 3-point scale ranging from 1 (“Detractors”) to 3 (“Promoters”).
Definitions and examples of phrases associated with each group include:
Promoters (Score 3): These customers are highly satisfied and enthusiastic about the company, demonstrating strong loyalty and a high propensity to recommend it to others. They are considered brand advocates. For Example, “totally impressed quality ~4”
Passives (Score 2): These customers are generally satisfied but not particularly enthusiastic. They are unlikely to actively promote the company but are also not at high risk of churn. For Example, “average sort experience ~4”
Detractors (Score 1): These customers are dissatisfied and at risk of negatively impacting the brand through negative word-of-mouth. They represent areas needing immediate attention and improvement. For Example, “diabolical service throughout ~4”
Each response category is then scored based on what is found in the call transcript.Calculation:
NPS = (NPS Promoters / Total Number of Responses) – (NPS Detractors / Total Number of Responses)
Note: “Total Number of Responses” refers to the number of calls where any of the phrases for NPS are picked up. When none of the phrases are picked up, that call is ignored.
Based on research and industry standards, the calculation for NPS does not consider “NPS Passives”.NPS is most valuable for measuring overall customer loyalty and the health of long-term customer relationships. It is typically deployed through surveys conducted on a periodic basis, such as quarterly or bi-annually, to track trends in customer sentiment over time.
Net Promoter Score Benchmark (NPS)
Rating Category Score Range (Raw: -100 to +100) Score Range (Decimal: -1 to +1) Interpretation Good Above 30 Above +0.30 Strong customer loyalty and advocacy Average 0 to +30 0 to +0.30 Industry standard performance Poor Below 0 Below 0 Improvement needed, more detractors than promoters Industry Average +17 +0.17 Benchmark across all industries NPS varies significantly by industry. Specialty stores can average around +56 while internet services might be as low as –3. The decimal format applies when calculating (% Promoters – % Detractors) without multiplying by 100.
The Customer Effort Score (CES)
Definition: Customer Effort Score (CES) is a metric that quantifies the level of effort a customer perceives they have to exert to resolve an issue, complete a task, or utilize a product or service. It focuses on minimizing friction in the customer experience. The CES is derived from customer responses to a question designed to gauge the ease of their interaction, such as: “How easy was it to interact with us?”
Responses are commonly captured using a numerical rating scale – in this case a 5-point scale ranging from 1 (“Very Easy”) to 5 (“Very Difficult”). Customer feedback is then categorized into five distinct levels of effort; each associated with specific phrases identified in the conversation:
Very Easy (Score 1), For Example, “zero difficulties whatsoever ~4”
Easy (Score 2), For Example, “generally uncomplicated process ~4”
Neutral (Score 3), For Example, “standard complexity level ~4”
Difficult (Score 4), For Example, “far too complicated ~4”
Very Difficult (Score 5), For Example, “insufferably complex ~3”
Each response category is then scored based on what is found in the call transcript.Calculation:
CES = ((CES Very Easy Calls x 1) + (CES Easy Calls x 2) + (CES Neutral Calls x3) + (CES Difficult Calls x 4) + (CES Very Difficult Calls x 5)) / Total number of responsesA lower CES score generally indicates a better customer experience, signifying less effort required.
“Total Number of Responses” refers to the number of calls where any of the phrases for CES are picked up. When none of the phrases are picked up, that call is ignored.CES is particularly valuable for evaluating the ease of specific customer interactions such as support inquiries, onboarding processes, and checkout experiences. It helps businesses pinpoint areas where processes can be simplified and the overall customer journey made more effortless.
Customer Effort Score Benchmark (CES)
Rating Category Score Range (1-5 Scale) Equivalent Percentage Interpretation Good 1.0 to 2.5 0% to 37.5% Low to reasonable effort required Average 2.6 to 3.5 37.5% to 62.5% Industry standard effort Poor 3.6 to 5.0 62.5% to 100% High to excessive effort required Industry Average 3 50% Benchmark across all industries For CES, lower scores/percentages are better as they indicate less customer effort required. This table uses the 1-5 scale where 1 (0%) represents “Very Easy” and 5 (100%) represents “Very Difficult”.
Percentage Calculation: (Score – 1) / 4 x 100
For Example:High customer effort Poor 4.6 to 5 90% to 100% Excessive effort - Customer Satisfaction KPI Card: This visual provides a single KPI card visual that displays the following information for each of the three metrics (CSAT, NPS, and CES): o Current Scores: The most recent value for the respective metric.
Month on Month (MoM) Percentage Difference: The percentage change in the metric’s value compared to the previous month.
Positive Engagements: The number of positive feedback instances contributing to the metric.
Neutral Engagements: The number of neutral feedback instances contributing to the metric.
Negative Engagements: The number of negative feedback instances contributing to the metric.It provides a unified view of the current standing and recent performance trajectory of the core customer satisfaction indicators. This allows for a quick comparison of performance across different metrics and an immediate understanding of whether satisfaction and loyalty are improving or declining. The inclusion of positive, neutral, and negative engagement volume provides context to the score changes.

- Customer Satisfaction Metrics by Agent This visual allows the user to visualize and compare the performance of individual customer service agents across the three customer satisfaction metrics (CSAT, NPS, and CES). This allows for the identification of top-performing agents, areas where individual agents may need additional support, and the overall distribution of customer satisfaction across the service team.
It provides a granular view of customer satisfaction performance at the individual agent level. This enables targeted interventions, such as recognizing high-performing agents and providing coaching or training to those with lower scores. By comparing metrics across agents, it helps identify best practices and potential inconsistencies in service delivery. This visual supports efforts to improve overall customer satisfaction by focusing on agent-specific performance.

- Interactions by Sentiment Group: illustrates the distribution of customer interactions based on the sentiment expressed within them. This provides a clear understanding of the overall categorization of customer feedback and highlights the proportion of Positive, Neutral, and Negative interactions.
In the donut chart where the whole circle represents the total number of customer interactions, and each segment represents a sentiment group (Positive, Neutral, Negative). The size of each segment is proportional to the number or percentage of interactions belonging to that sentiment.
This visual offers a high-level overview of customer sentiment trends within the collected interactions. A larger positive segment indicates a generally positive categorization of customer feedback, while a significant negative segment may signal areas needing attention. The neutral segment provides context on the volume of feedback that is not strongly categorized as positive or negative. This visual helps in quickly assessing the overall customer sentiment categorization and identifying potential areas of concern or success.

- Customer Satisfaction Call Listing: This visual provides a detailed, granular view of recent customer interactions, along with the associated satisfaction scores, and direct access to the underlying conversation data. The data table displays individual customer calls as rows. Key columns include Date/Time of call, Agent involved, CES score, CSAT score, and NPS score. This visual provides a detailed examination of individual customer interactions, allowing for the correlation of satisfaction scores with the actual conversation content.

- Customer Satisfaction Scores by Date: This visual allows the analytics user to visualize the evolution of the overall CSAT, NPS, and CES scores over time. This allows for the identification of trends, patterns, and potential fluctuations in each metric, helping to assess the impact of changes or events on overall customer satisfaction and loyalty. It provides a dynamic and comparative view of customer satisfaction and loyalty over time. By observing the trends of all three metrics simultaneously, analytics users can gain a more comprehensive understanding of customer sentiment and identify any correlations or divergences in their movements. This helps in evaluating the long-term impact of strategies across different facets of customer experience and proactively address any negative trajectories or capitalize on positive momentum.

- Customer Satisfaction by Agent Heat Map: The purpose of this visual is to visualize the performance of individual agents across various satisfaction metrics, allowing for quick identification of high and low performers. The matrix visually represents each agent, with their individual CES, CSAT, and NPS scores clearly presented thereby providing a visual representation of agent performance across key satisfaction indicators, enabling managers to quickly identify top performers, those needing coaching, and potential trends for specific agents or across different metrics.

The Customer Satisfaction Dashboard is structured to provide a comprehensive understanding of customer sentiment and agent performance through a series of interconnected and interactive visuals. It begins with the Customer Satisfaction KPI Card, offering an immediate, high-level snapshot of key satisfaction metrics (CSAT, NPS, CES) and associated positive, neutral (for CSAT/CES), and negative feedback volumes, highlighting current performance and recent trends. Clicking on any of the metrics within the KPI Card will dynamically filter the data across all other visuals on the dashboard, allowing users to focus their analysis on a specific satisfaction indicator.To dissect the overall satisfaction at an individual agent level, the dashboard presents the Customer Satisfaction Metrics by Agent bar chart. This visual allows for a direct comparison of agent performance across the core satisfaction metrics, facilitating the identification of top performers and areas for targeted development. This chart, like others, will be updated to reflect the metric selected on the KPI Card.
Complementing this agent-centric view is the Customer Satisfaction by Agent matrix, providing a consolidated heat map of agent performance across various satisfaction metrics. This enables a quick identification of performance patterns and potential areas of focus, and will also respond to selections made on the KPI Card.
To understand the broader context of customer feedback, the Interactions by Sentiment Group donut chart illustrates the distribution of customer interactions by positive, neutral, and negative sentiment, offering an immediate grasp of the overall customer sentiment landscape, which will be refined based on the chosen KPI.
For a granular examination of individual customer interactions, the Customer Satisfaction Call Listing provides a detailed tabular view, linking sentiment and satisfaction scores with specific call data. This allows for in-depth analysis of the drivers behind satisfaction scores, filtered according to the selected metric.
Finally, the Customer Satisfaction Score by Date trend line chart visualizes the evolution of CSAT, NPS, and CES over time. This enables the identification of trends and the assessment of the impact of operational changes on customer satisfaction and loyalty, with the displayed trend adapting to the metric selected on the KPI Card.This structured and interactive flow of visuals allows users to move from a high-level overview to detailed agent performance and individual interaction analysis, dynamically filtering the data based on their specific area of interest, ultimately providing a holistic and adaptable understanding of customer satisfaction.
- CX Self-Service Dashboard
The CX Self-Service Automation Identification Dashboard provides a clear overview of how customer interactions are being automated to enhance the customer experience and optimize operational efficiency. Its primary goal is to track and identify opportunities for automating customer service tasks, enabling businesses to reduce wait times, improve customer satisfaction, and streamline internal processes. By identifying interactions suitable for self-service automation, the dashboard helps drive cost reduction and improve customer accessibility through optimized channel utilization.
The dashboard focuses on key self-service and automation areas, including:- Customer Self-Service: This includes functions like account information updates, password resets, and order tracking, where customers can independently handle tasks through automated systems without needing agent assistance.
- Agent-Assisted Tasks: Tasks such as data entry and document retrieval can be enhanced with automation tools that assist agents in providing faster, more accurate service.
- Back-Office Automation: Critical back-office tasks, including report generation and invoice processing, are automated to reduce manual effort, improve accuracy, and free up resources for more strategic work.
By monitoring and analyzing self-service automation metrics, the dashboard helps businesses identify areas where further automation can be implemented, track the effectiveness of existing automation solutions, and ensure a seamless experience for both customers and agents. - CX Self-Service Opportunities KPI Card: provides an overview of performance for each opportunity, comparing month-to-date (MTD) figures against the previous month. It offers a quick, high-level view of key performance indicators for each opportunity, helping track changes over time.

- CX Self-Service Rate by Question: displays the percentage of calls where self-service opportunities were identified and highlights the effectiveness of self-service identification across different opportunities.

- CX Self-Service Hits by Date: visualizes historical trends and forecasts when specific opportunities are likely to occur in the future, based on past data and helps predict future call volumes for specific self-service opportunities.

- CX Self-Service Hits by Site Name (with Drilldown for Agent Group & Agent): visualizes which sites, agent groups, and individual agents are most often transferring calls, allowing for prioritization of call-routing solutions. It helps identify where process improvements can be made, and which teams need more focus on self-service automation.

- CX Self-Service Hits, Agent Sentiment and Caller Sentiment by Opportunity: visualizes the most frequently hit opportunities and identifies which ones have the worst sentiment for both agents and callers. It shows areas with high opportunities and areas where sentiment needs improvement for both agents and callers.
 The CX Self-Service Automation Identification Dashboard empowers analytics users to optimize self-service performance through a dynamic and data-driven approach. It delivers actionable insights by providing:
 - Key Performance Indicator (KPI) cards for quick assessments of performance across automation opportunities.
- Interactive charts and graphs for detailed analysis, including trend lines with forecasting, to track performance and predict future outcomes.
- Detailed breakdowns of performance by question, site, agent group, agent, and sentiment, enabling users to pinpoint impacted areas.
Selecting an automation opportunity dynamically filters all visuals, allowing for focused analysis. This integrated functionality enables users to identify optimization opportunities, enhance customer experience, and drive efficiency.
- Phrase Hits Analysis Dashboard
This dashboard is designed to empower analytics users to gain valuable insights from recorded conversations, focusing on the occurrence and context of specific phrases within those interactions. By leveraging the visualizations within this template, analytics users can efficiently analyze call data, identify key trends, and understand how language is used in relation to evaluation metrics.The primary objective of this dashboard is to enable users to effectively analyze the usage of specific phrases within recorded conversations. It aims to provide a clear and actionable understanding of:
- Where and when specific phrases are being used.
- How phrase usage relates to call evaluations and scoring.
- The context in which these phrases are spoken within individual conversations.
- Overall trends and patterns in phrase usage across multiple calls.
Ultimately, this dashboard is intended to facilitate data-driven decision-making for improving agent performance, refining evaluation processes, and gaining deeper insights into customer interactions.
- Call Listing Table: provides a granular view of all recorded calls within the specified date range/time period. It serves as the primary point of entry for in-depth analysis. The table displays key information about each call, including the Audio Duration, Agent who handled the call, AQA Score, percentage of Silence, percentage of Overtalk, and Agent- and Caller Sentiment. Analytics users are able to quickly scan and select specific calls for further investigation using other dashboard visuals.

- Phrase Hits by Agent (with drilldown for Phrase): Displays the total number of tracked phrase hits attributed to each agent. It allows for a comparison of phrase usage across different agents and serves as a starting point for identifying top and bottom performers in terms of specific phrase occurrences. The visual displays each agent’s name along the vertical axis and the corresponding count of phrase hits on the horizontal axis. It includes a drilldown capability to view the specific phrases contributing to each agent’s total. Analytics users are able to identify agents with the highest and lowest frequency of tracked phrase usage. The drilldown feature allows for further investigation into the specific phrases used by each agent, which can inform coaching opportunities, highlight best practices, or reveal potential areas of concern regarding adherence to language guidelines.

- Phrase Hits by Scorecard, Section, Question, and Phrase: provides a multi-dimensional view of phrase hits within a selected call, pinpointing where specific phrases were used and correlating phrase usage with the evaluation structure. The matrix displays phrase hits across different levels: Scorecard, Section, Question, and Phrases, allowing Analytic users to understand how and where phrases are used in the context of the evaluation, identifying trends and patterns in phrase usage.

- Transcription: provides a detailed, textual representation of a selected call, and to visually highlight instances where tracked phrases were spoken. The textual transcript with highlighted phrases provides a complete record of the conversation, enabling Analytics users to understand the context in which phrases are used and to facilitate qualitative analysis.
 Phrase Hits by Section and Scorecard (with drilldown for Questions and Phrases): provides a summarized overview of phrase hits, organized by scorecard sections, and to enable drilldown to more granular data. The visual summarizes phrase hit data, shows which scorecard sections have the most hits, and allows Analytics users to drill down to identify areas where agents may need training or where they excel.
 The visuals on the Phrase Hits Analysis dashboard template are designed to work guiding users through a step-by-step process of looking at and understanding the call information. This connection means that when an Analytics user interacts with one visual, it can change what is seen in the others, helping to focus on the most important details.
 - Start with the Call Listing Table: Analytics users typically begin their analysis by reviewing the Call Listing table. This provides an overview of all available calls, allowing them to filter and select specific calls of interest based on relevant criteria. Selecting a specific call allows for deeper analysis.
- Identify Overall Agent Performance Regarding Phrase Usage: The Phrase Hits by Agent visual provides an overview of how frequently each agent uses the tracked phrases across all their calls within the selected timeframe. This allows Analytics users to quickly compare agent performance in terms of adhering to or deviating from desired language. The ability to drill down and see the specific phrases used by each agent offers further insight into individual tendencies and potential areas for coaching or recognition.
- Examine Phrase Usage within the Evaluation Structure: The Phrase Hits by Scorecard, Section, Question, and Phrase matrix then displays where the tracked phrases occurred within the selected call, broken down by the different levels of the evaluation scorecard. This helps Analytics users understand the relationship between phrase usage and the evaluation framework.
- Understand the Context of Phrase Usage: To gain a deeper understanding of how the phrases were used, users can refer to the Transcription visual. This visual provides the full transcript of the selected call, with the identified phrases highlighted within the surrounding conversation. This allows for qualitative analysis and understanding of the context.
- Identify Broader Trends and Areas of Focus: The Phrase Hits by Section and Scorecard visual provides a summarized view of phrase hits across all (or a filtered set of) calls, organized by scorecard sections. This allows Analytics users to quickly identify which areas of the evaluation have the most or least phrase hits. The drilldown functionality enables further investigation into specific questions or even the individual phrases contributing to the counts within each section. This can highlight areas where agents may consistently use specific language or where certain evaluation sections are particularly relevant to phrase usage.
By following this flow, Analytics users can move from a high-level overview of call data to a detailed understanding of specific phrase occurrences within individual conversations and broader trends across multiple interactions.
Now that you know the purpose and features each of the predefined dashboard templates provide, it is appropriate to look at the second way an analytics user may create a custom dashboard.
The second way in which an analytics user may create a dashboard is to click the Add Dashboard icon in the My Configured Dashboards tab. Doing so will result in another view appearing. An example of this is illustrated in Figure – Creating a Dashboard.
- Overview Dashboard
Figure – Notification Actions

Figure – Creating a Dashboard
The analytics users have access to various functions, including:
- Adding or removing dashboard filters.
- Modifying the dashboard name and description.
- Adjusting the dashboard layout.
On the left of the view are a number of pre-created visuals (illustrated by 1 in Figure – Creating a Dashboard) that the analytics user may drag-and-drop to Add Visual on the dashboard, indicated by 2 in Figure – Creating a Dashboard. There are a number of predefined dashboard layouts an analytics user may choose from. These are selectable by clicking the desired layout icon illustrated by 3 in Figure – Creating a Dashboard. As the analytics user drags visuals from the ‘visual’ panel as illustrated by 4 in Figure – Creating a Dashboard, to the dashboard Add Visual section 2 in Figure – Creating a Dashboard they are creating, the current number of visuals permitted per dashboard as well as the current number of visuals applied to the dashboard is displayed, as illustrated by 5 in Figure – Creating a Dashboard. Currently, each dashboard may contain a maximum of six visuals. Once this number is reached, no further visuals may be added to the dashboard. An analytics user may however remove a visual and replace it with another. Setting a dashboard as the default means the dashboard will be the first to load when viewing the My Dashboards page.
Note: For each customer’s account the pre-created visuals, as illustrated by 1 and 4 in Figure – Creating a Dashboard, are published in this section. These visuals will be applicable to the customer’s business and may contain visuals such as Call Sentiment, Silence, Overtalk, Call Listing, Chat with Data, et cetera as determined appropriate by CallCabinet’s analytics team. CallCabinet’s analytics team ensures these visuals relate (or attach) to the customer’s data, providing instant visual metrics once the dashboard has been completed.
An analytics user may click on the Visual Types dropdown list, as illustrated by 6 in Figure – Creating a Dashboard and select the type of visual they desire. An example of this dropdown list is;

Once selected, all the available visuals relating to the type selected will appear in section 1 illustrated in Figure – Creating a Dashboard. The analytics user would then select the desired visual, as indicated by 4 in Figure – Creating a Dashboard and drag-and-drop it into the dashboard’s Add Visual section illustrated by 2 in Figure – Creating a Dashboard currently being created. Incidentally, the analytics user may also search for a visual, by typing the required visual’s name in the Search Visuals search field. For example, ‘chat’ would result in a Chat with Data visual being displayed in section 1 illustrated in Figure – Creating a Dashboard which the analytics user may then drag and drop onto the dashboard as described earlier. Likewise, entering ‘sentiment’ will render numerous visuals the analytics user may choose from.
The analytics user may set default filters that they may use to filter the visual data, in real time. This is achieved by dragging the desired filter from the Visual Types column to the Add Filter section indicated by 7 in Figure – Creating a Dashboard. What is important to understand is that only those visuals that are marked as a filter may be applied. For example, in the Visual Types dropdown list, as indicated by 6 in Figure – Creating a Dashboard, the user may select ‘Filter Date Range’, or ‘Filter Date Period’ and then drag the visual to Add Filter (illustrated by 7 in Figure – Creating a Dashboard).

Figure – Drag Filter
To amplify this explanation a little further, the Figure – Drag Filter illustrates a dashboard that has a visual already added (as indicated by 1). To add a filter the user selects the filter and drags it to Add Filter as illustrated by 2 in Figure – Drag Filter. Once done, the filter is displayed. For example;

This filter will be available to the analytics user, when viewing the dashboard, to select the criteria they would like to apply for all the visuals rendered in the dashboard.
The purpose of each of the filters available are:
- Agent Dropdown: Using the dropdown, analytics users can select a specific Agent to view their interactions and update the dashboard metrics for that specific Agent. This is helpful for individual Agent performance analysis or identifying training needs.
- Agent Clarity Slider: This filter gives analytics users the ability to filter data based on the audio clarity scores to evaluate audio quality during calls.
- Agent Clarity Bin Dropdown: With this filter, analytics users are able to group calls into bins based on Agent Clarity ranges. The Agent Clarity Bins are split into intervals of ten (10) percent starting with the 0-10% range and going up to 90%+.
- Agent Group Dropdown: Filters data based on a specific Agent Group. This can be useful for comparing performance across different Agent Groups and identifying areas for improvement and training needs
- Agent Sentiment Slider: Filters data based on Agent Sentiment, and this can be used to identify calls where the Agent was stressed or unprofessional or where the Agent handled the call well.
- Agent Sentiment Group Dropdown: Allows analytics users to group calls by Agent Sentiment categories, either “Negative”, “Neutral”, or “Positive”.
- Audio Direction Dropdown: Filters data based on the direction of the audio (Inbound or Outbound). This can be useful for analyzing different types of interactions.
- Audio Duration Bin Dropdown: Groups calls by ranges of Audio Duration.
- Audio Duration (Mins) Slider: Filters data based on the call duration (in minutes) that the analytics user specifies using the slider. This can be used to identify long or short calls, which may indicate specific issues or opportunities.
- Call ID Filter Dropdown: The Call ID filter allows analytics users to search or filter data by a unique CallID. This provides the ability to access a specific call record.
- Call Options Dropdown: Filters data based on the type of call, which is categorized as follows:
External Calls: Calls between an agent and an external phone number, i.e., the external number is a phone number.
Internal Calls: Calls between two Agents, where the external number is an Agent ID.
Meetings: Calls involving more than two participants or identified as Microsoft Teams meetings. This can be useful for analyzing different types of interactions. - Caller Clarity Slider: The Caller Clarity filter gives analytics users the ability to narrow down calls by caller clarity score to assess audio problems on the customer’s side.
- Caller Clarity Bin Dropdown: Analytics users will use this filter to group calls into bins based on Caller Clarity ranges.
- Caller Sentiment Slider: By filtering data based on the Caller Sentiment, analytics users are able to identify calls where the Caller was frustrated or dissatisfied or happy.
- Caller Sentiment Group Dropdown: Allows analytics users to group calls by Caller Sentiment categories, either “Negative”, “Neutral”, or “Positive”.
- Date Slider: Allows analytics users to select a specific date range to filter the data. This allows data to be narrowed down to the events on a specific date.
- Day Dropdown: Analytics users will use this filter-to-filter data by day of the week, e.g., Monday, Tuesday.
- Hour of Day Dropdown: The Hour of Day filter allows analytics users to filter data by specific hours of the day to analyze time-based events.
- KPI Metric Selector Dropdown: When analytics users select a specific KPI Metric from the dropdown, the data will be dynamically adjusted and displayed on the dashboard. The KPI Metrics that are available for analytics users to choose from are:
Agent Sentiment (%)
AQA Score
Avg Audio Duration (Mins)
Caller Sentiment (%)
Interactions
Overtalk (%)
Silence (%) - Month Dropdown: analytics users can select a specific month to view data aggregated for that month.
- Overtalk Slider: Filters data based on the percentage of time where the Agent speaks over or is constantly interrupting the Caller. This can be used to identify potential communication breakdowns, or areas where Agents may need to improve their active listening skills, or areas where the Agent requires additional training.
- Overtalk Bin Dropdown: Allows analytics users to group calls into bins based on Overtalk ranges.
- Phone Number Dropdown: Analytics users will use this filter to analyze data for specific customers.
- QA Type Dropdown: The QA Type filter allows analytics users to filter calls based on their QA Type, which can be either Auto QA or Manual QA.
- QC Section Dropdown: Filters data by a specific scorecard section for focused analysis.
- Quarter Dropdown: Allows analytics users to choose a quarter, e.g., 1 or 2, to analyze data grouped into a three-month period.
- Question Dropdown: The Question dropdown allows analytics users to filter by specific AQA Questions that were logged during call evaluations.
- Scorecard Dropdown: Filters data by a specific AQA Scorecard. This allows analytics users to evaluate specific call outcomes.
- Silence Slider: Using the slider, analytics users can filter data based on the percentage of silence in the conversation. This can be used to identify areas where Agents may need to improve their speaking pace or engagement and highlight training needs.
- Silence Bin Dropdown: Allows analytics users to group calls based on Silence ranges.
- Site Dropdown: Filters data based on the site or location where the interaction occurred. This can be helpful for identifying regional trends or issues.
- Suppression Calls Dropdown: This filter gives analytics users the ability to filter based on calls that have been marked as suppressed in the frontend portal.
- Topic Dropdown: The Topic filter narrows data based on Topics or reasons for calls, for example Billing or Support.
- Words per Minute Slider: This filter allows analytics users to identify Agents who speak too quickly or too slowly. These metrics can then be used to identify areas where training is needed.
- Words per Minute Bin Dropdown: Allows analytics users to group calls into bins based on speaking rate (Words per Minute) ranges.
Once the analytics user has completed configuring their dashboard, they may decide whether this dashboard should be the default dashboard rendered when viewing their My Dashboards page. To do this, the analytics user would click the Set as Default Dashboard checkbox as indicated by 3 in Figure – Drag Filter.
The final action required by the analytics user when creating a dashboard is to give it a name, as illustrated by 4 in Figure – Drag Filter. The user may provide an explanation as to the purpose of this dashboard, by entering information in the description field as illustrated by 5 in Figure – Drag Filter. Should the analytics user want to add tags to this dashboard, they may do so by entering a name for the tag and then adding it by clicking the Add Tag button as illustrated by 6 and 7 respectively in Figure – Drag Filter. Adding a tag is useful for filtering the analytics user’s dashboards rendered on their My Configured Dashboards and Dashboard Templates tab views. When an analytics user selects the tag (or tags) in the tag listing, then only those dashboards that have those tags attached will be displayed. Doing this may help to minimize the ‘visual noise’ on the view allowing the analytics user to focus on particular dashboards. The user would then click the Save Dashboard button illustrated by 8 in Figure – Drag Filter.
Being able to create their own dashboards, with the views and metrics desired, provide an analytics user with powerful tools to gain important insight into their recorded calls.
Depending upon the visual the analytics user places on a dashboard, different behavior may occur. As an example, let us assume that the analytics user created a dashboard that focuses on interactions between customers and agents. An example of this type of dashboard is illustrated in Figure – Interaction Dashboard.

Figure – Interaction Dashboard
As can be seen there are six visuals on this dashboard. The analytics user is able to glean further information by hovering their cursor over the various visuals. Depending on the visual, there is different functionality. For example, if the analytics user hovers over one of the vertical bars in the bottom left visual, Interactions By Agent, a context menu appears, something like this;
Notice that the popup for this view renders the agent’s name and the number of interactions they have participated in. A button also appears, Drill down. Clicking this allows the analytics user to evaluate this agent’s interactions a little further. Notice how the dashboard changed in Figure – Agent Drill Down. The information rendered is applicable to the selected user

Figure – Agent Drill Down
Once again, if the analytics user hovers their cursor over any of these visuals, more granular information is rendered.
Figure – Another Dashboard is a dashboard in which a date filter is being applied and which contains other visuals, inter alia AQA (Automated Quality Assurance) results, overtalk and silence.

Figure – Another Dashboard
As an analytics user, CallCabinet encourages you to experiment with the various visuals, dashboards and related functionality.
Editing a Dashboard
Editing an existing dashboard in the Analytics portal allows you to customize visualizations, update filters, and reorganize the layout to better suit your evolving business needs. This flexibility ensures that dashboards remain relevant and actionable as data priorities change over time.
To edit a dashboard:
- On the Analytics page, navigate to the My Dashboards tab and select the dashboard you want to edit. You can switch between dashboards using the carousel or dashboard list.
- Click the Manage Dashboards button to open the dashboard management view where you can make changes.
- Modify the dashboard based on your requirement.

- Click Save As and click either of the following:
- Dashboard:Save your changes to the current dashboard, updating its visuals, filters, and layout.
- New Template:Save your configuration as a template, allowing you and other users to easily create new dashboards with the same structure and options in the future.
When you click New Template, you are redirected to the Dashboard Templates page. The edited dashboard is saved as a template and automatically appears in the list on the Dashboard Templates page. It is added as the last item in the list, and the template name is shown with the creator’s name in brackets. When you attempt to edit the saved template without changing the template name, the following error is displayed:
Template with <template_name> name already exists. Please, choose another one.
Note: Creating, editing, and deleting templates is available only to QA Admins of the your account. However, only the user who originally created a dashboard or template can edit it.
Managing Settings
The Analytics Settings page allows you to define and customize sentiment classifications for specific words and phrases. This customization enhances the accuracy of sentiment analysis by enabling you to assign emotional categories tailored to their business context.
Adding Custom Sentiment Classifications
You can customize sentiment analysis by adding new words or phrases to the sentiment classification list. This feature allows for more accurate and context-specific sentiment results in conversation analytics.
To add a new phrase:
- On the Analytics page, click Settings
- In the New Phrase box, enter the desired word or phrase you want to classify.
- From the sentiment drop-down list, select the appropriate sentiment category for the phrase: Positive, Neutral, or Negative.
- Click Submit.
The new phrase is added and immediately displayed in the list of classified phrases.
Editing Classifications
You can update existing phrases in the sentiment classification list to reflect changes in sentiment context or correction of prior classifications.
To edit an existing phrase:
- On the Analytics page, click Settings
- Locate the phrase you wish to edit in the sentiment classification list.
- Click the Edit icon corresponding to the phrase that you want to edit.
- In the Modify adjustment dialog, update the required field such as phrase and classification and click Save.
Deleting Classification
You can remove phrases from the sentiment classification list to maintain a relevant and accurate set of custom sentiment rules.
To delete an exiting phrase:
- On the Analytics page, click Settings
- Locate the phrase you wish to edit in the sentiment classification list.
- Click the Delete icon corresponding to the phrase that you want to delete.
- In the Delete Sentiment Adjustments dialog, click Confirm.
The phrase is deleted from the list.
Searching and Filtering Phrases
The sentiment classification list supports search and filter options to quickly locate specific phrases and manage large sets of sentiment rules.
To search for phrases, enter the required phrase in the search box.
AI Agent in the Analytics Portal
The AI Agent is a core feature within the Analytics section of the portal, allowing users to interact with data through natural language queries across all call records, with the added option to apply filters. The agent processes the query using an advanced model to identify the most relevant calls and then leverages a large language model to generate a concise, summarized response. Users can further refine their results by applying filters, which helps increase the accuracy of the response.
Initially, the AI Agent is designed to address executive-level queries, offering actionable insights into critical business questions, such as, “Why are my users dissatisfied with product X?” Additionally, the agent includes powerful Retrieval-Augmented Generation (RAG) capabilities, providing on-demand assistance for tasks such as scorecard creation and advanced search functionalities within the portal.
When an Analytics user clicks the Analytics tablature indicated by 1 in Figure – AI Agent GPT View Page, the general analytics view will be rendered. A menu is displayed in the left panel, and should the user click the AI Agent menu item as indicated by 2 the AI Agent GPT view page is rendered. A user may proceed in asking any question relating to CallCabinet and the calls recorded by applying that question to the ‘Ask AI Agent’ field, pressing enter once done.

Figure – AI Agent GPT View Page
The AI Agent will provide its findings, as illustrated in Figure – AI Agent Answer. You will soon discover that the information returned by the AI Agent is extremely comprehensive. The Analytics user will have the ability to engage in a continuous conversation where the model retains complete context, ensuring seamless reference to prior interactions.

Figure – AI Agent Answer
As mentioned, any question may be asked. For example: “How do I create a scorecard”. The executive AI Agent will respond with a step-by-step process on how this is achieved. Another question may be “Did the agent introduce themselves?”. Essentially, any question concerning the CallCabinet application or any call may be asked. The agent is an executive agent that is capable of providing answers to anything CallCabinet related.
Once questions have been asked, a record of those questions is kept and displayed, as indicated by 4 in Figure – AI Agent GPT View Page. An Analytics user can access this full conversation history, allowing them to effortlessly pick up where previous discussions concluded. This is illustrated by Figure – Executive Agents.

Figure – Executive Agents
It is highly recommended, by CallCabinet, that before an Analytics user starts asking the AI Agent questions, the Analytics user applies filtering against the calls. Doing so will greatly improve the results returned by the AI Agent. To apply filters, the Analytics user would click the Call Filters button, as indicated by 5 in Figure – AI Agent GPT View Page. When the Analytics user clicks this button, a dialog is rendered, as illustrated by Figure – Call Filters.
Currently, the filters that may be applied are;
Date Rage,
Agent Group,
Agent,
Call ID,
Direction,
Duration,
Extension,
Site ID,
Number.
Once the Analytics user has selected the filters and set the criteria they would like to use, they must click the Apply button. Once done, the Analytics user would then go and pose questions for the AI Agent to answer.

Please note that the user that is logged in and performing queries, the AI Agent will take the user’s role into account. As an example, a user may not ask questions about any calls they are not allowed to view or listen to.
Notifications allow a user to add alerts based on custom created rules. These notifications are triggered by the Quality Assessment (QA) evaluation process. This feature enables users who have the appropriate permission to track critical trends in their data and receive timely Notifications when significant changes occur. This assists a business in making appropriate decisions as a result of these real-time insights.
When an Analytics user clicks the Analytics tablature indicated by 1 in Figure – AI Agent GPT View Page, the general analytics view will be rendered. A menu is displayed in the left panel, and should the user click the Notifications icon, illustrated by 8 in Figure – AI Agent GPT View Page, the following Figure – Notifications Activity view is rendered.

Figure – Notifications Activity
This table provides a detailed overview of past notifications, enabling the Analytics user to effectively monitor and analyze Notification Events with precise information on when and why they were triggered. An example of this Activity log is illustrated in Figure – Notification Activity.
Each Notification Log includes the following key details:
- Time Stamp: The exact time when the Notification was triggered.
- Title: The name of the Notification for easy identification.
- Type & Level: The category and severity of the Notification.
- Description: A concise explanation of the event that triggered the Notification.
- Notification: Whether a Notification was sent.
- Triggered Calls: The number of calls that triggered the Notification.
By clicking on the caron (v) associated with any notification, an Analytics user may access additional in-depth information, including:
- Condition: The specific metric that was being monitored.
- Trigger: The rule or threshold that activated the notification.
- Call Link: A direct link to the recorded call for further review.
For example:

When the Management tablature, as illustrated by 1 in Figure – Notification Management is selected, all the notification configurations are displayed in a table.

Figure – Notification Management
The table consists of a number of columns. These are;
- Name: A meaningful name given to the notification.
- Created: The day and time the notification was created.
- Flow Type: This indicates whether it is the Standard trigger flow or triggering that occurs during the Analytics flow process.
- Last Trigger Date: This is the latest date and time this event triggered a notification.
- Type: This details the event that will trigger a notification. Examples of a type are, silence, keyword and AudioDuration.
The user may decide which columns they would like visible, or removed from the notification table by clicking the ‘Edit Columns’ button illustrated by 2. From the dialog that appears the user may make the changes they require. Once done the user must not forget to click the Save button to enforce their changes. Should the user click the Default button in the Edit Columns dialog, then all possible columns are displayed in a predetermined order in the Notification table.
It is possible for an admin user to edit any of the notifications rendered in the table by clicking the Edit icon associated with the notification configuration they would like to change. This is illustrated by 3. Likewise, a notification may be removed by clicking on the Trash icon, as illustrated by 4, that is associated with the notification the Analytics user wishes to delete. This page provides the Analytics user with an overview of all the Notification Event configurations that have been created.
If an Analytics user wishes to create a new Notification, there are two processes they may select from. One, use the wizard, or two, go straight to the Review page and enter all the required information there. To create a new notification using the wizard, the Analytics user must make sure that the checkbox ‘Skip Wizard’ is unchecked illustrated by 6 in Figure – Notification Management, then go ahead and click the New Notification button as illustrated by 5 in Figure – Notifications. This results in a ‘wizard’ being rendered, which guides the user through a step-by-step Notification creation process:

Figure – Notification Type
The Notification Window defines the call volume threshold required to trigger the notification. The user is first required to decide on the Window configuration type from the Type dropdown list. Currently there are two options, Interval and Interaction;
If the user selects Interval, they are then required to enter the timeframe in Hours in which calls should be grouped and then evaluated before triggering a Notification event. For example;

These Notification Types in the dropdown list are predefined by CallCabinet and are immutable. At the moment the Notification Type options are;
| Notification Type | Description |
| AudioDuration | The total duration of the call, measured in seconds, provides valuable insights into conversation length for enhanced performance tracking. |
| Overtalk | The percentage of the call where both parties spoke simultaneously, offering a clear view into communication dynamics and potential areas for improvement. |
| Silence | The percentage of the call marked by pauses or quiet moments, allowing you to gauge engagement and optimize call flow. |
| CallSentiment | A comprehensive analysis of the overall sentiment of the call, helping to assess the context of the conversation. |
| CallerSentiment | A breakdown of the caller’s sentiment throughout the call, providing insights into their satisfaction and engagement levels. |
| AgentSentiment | An analysis of the agent’s sentiment during the call, offering valuable feedback on their interaction style and effectiveness. |
| Phrases | A detailed list of key phrases detected during the call, enabling quick identification of critical topics and themes. |
| TopicDetection | Notifications triggered by the identification of predefined topics help to monitor specific areas of interest and ensure relevant discussions are highlighted. |
| QAScoring | Notifications triggered by the outcome of the QA Scorecard enable real-time monitoring of call quality and ensure compliance with performance standards. |
Once the user has entered the Name and selected the desired Type, they click the Next: Window button. The user is taken to the ‘Notification Window’ page, as illustrated by Figure – Notification Window.
NOTE: both the Name and Type fields are required fields, which means that they require values before the user is able to proceed to the next step in creating the Notification.

Figure – Notification Window
The Notification Window defines the call volume threshold required to trigger the notification. The user is first required to decide on the Window configuration type from the Type dropdown list. Currently there are two options, Interval and Interaction
If the user selects Interval, they are then required to enter the timeframe in Hours in which calls should be grouped and then evaluated before triggering a Notification event. For example;
Likewise, should the user select Interaction, they are then required to enter the Number of Calls to be evaluated before triggering a Notification event. For example;
Once done, the user clicks the Next: Triggers button. The user is taken to the Notification Triggers page, as illustrated by Figure – Notification Triggers.
NOTE: both fields are required fields, which means that they require values before the user is able to proceed to the next step in creating the Notification.

Figure – Notification Triggers
A trigger is used to validate and trigger a Notification when the condition is met. A user is able to set a maximum of three triggers per Notification. So, Notification Triggers define the specific thresholds used to evaluate aggregated call data and determine whether a Notification Event should be created.
The level of the notification may be: Info, Warning or Critical. This level is selected from the Level dropdown list. Once the user has selected the Level, they must select the Condition and associated value. NOTE: The options available in the Condition dropdown list is determined by the Notification Type selected earlier. For instance, if the user selected AudioDuration as the type, then the condition options are >= (greater-than or equal to) or <= (Less than or equal to). Likewise, if the user had selected a Notification Type of Phrases then the condition option is IN. Currently all possible options are
Examples of Trigger Conditions include:
- Less Than or Equal to ( <= )
- Greater Than or Equal to ( >= )
- IN (the value is within a specified list of values)
Once the user has selected the Condition, the value associated with that condition must be entered.
The user must also enter the Trigger Threshold (%). This value represents the percentage of interactions within the window that need to be considered for a trigger event to be fired. For example: If the user selects a Notification Window Configuration type of ‘Interval’ of 24 hours, and a trigger configuration of >= whose Trigger value (%) is 10% and the Trigger Threshold (%) is 50%, this means that a trigger will be fired if 50% of calls within the 24-hour period are above or equal to 10%.
Each Trigger has the option to enable Notify Trigger. When selected, the trigger will send a push notification through notification channels such as email or webhook. The configuration of these notification methods will be done later in the process. If the user does not check this checkbox, then the trigger will not be sent but will still be inserted into the activity log.
If the user would like to add another trigger Condition, they would click the +Add Trigger button that appears across the notification Trigger screen as illustrated in Figure – Notification Triggers.
The admin user proceeds to the next page once all the required fields have been populated with information, by clicking the Next: Cooldown button. This results in the Cooldown page being rendered, as illustrated in Figure – Notification Cooldown.

Figure – Notification Cooldown
A Notification Cooldown period configures the amount of time that must pass after a notification is sent before another notification may be issued. This helps prevent users from receiving excessive notifications in short time frames. The time interval is set in Minutes, where the minimum allowed interval is 30 minutes. Once the Cooldown period has been set, the user moves onto the next page, Notification Actions by clicking the Next: Actions button.

Figure – Notification Actions
Push notifications inform users about a new Notification Event. Please ensure that the Notify Trigger option is enabled when configuring Notification Triggers to activate notifications. Webhook is a POST URL where notifications will be sent. When the user checks this checkbox, the Webhook’s URL must be entered into the field that appears. Email is the email address where the notification will be sent when this checkbox is checked. When this is checked an email field appears in which the user may enter a list of comma-separated email addresses of the emails to which the Notification event is to be sent.
Should the Admin user want a Tag to be attached to the call that resulted in a Notification Event to occur, then they would check this box, and from the dropdown list which contains all configured Tags, select the Tag they would like to be attached to the call. This is very useful, as a user is then able to filter all calls in the Call Listing page that have the Tag attached.
An example of a Notification that may be sent is:


Figure – Notification Filters
Once the Admin user has completed entering the required Notification Actions, they would click the Next: Filters button which results in the Navigation Filters page being rendered, as illustrated in Figure – Notification Filters. Notification Filters allows for greater control by allowing an admin user to specify which interactions should be considered when evaluating Notification Triggers. For instance, the admin user can limit a Notification to specific Agents or Groups of Agents as well as Sites, by clicking on the Filters Type dropdown list. The current filter options are;
| Filter | Description |
| AudioDurationLessThan | Filters interactions where the call duration (in seconds) is lower than the specified value. |
| AudioDurationGreaterThan | Filters interactions where the call duration (in seconds) exceeds the specified value. |
| SiteName | Filters interactions based on the site associated with the interaction. |
| AgentGroups | Filters interactions based on the specific agent groups handling the interactions. |
| Agent | Filters interactions based on the specific agent who handled them. |
| SilenceLessThan | Filters interactions where the level of silence, measured on a scale from 0 to 1, is lower than the specified value. |
| SilenceGreaterThan | Filters interactions where the level of silence, measured on a scale from 0 to 1, exceeds the specified value. |
| OvertalkLessThan | Filters interactions where the level of overtalk, measured on a scale from 0 to 1, is lower than the specified value. |
| OvertalkGreaterThan | Filters interactions where the level of overtalk, measured on a scale from 0 to 1, exceeds the specified value. |
| SentimentLessThan | Filters interactions where the call sentiment, measured on a scale from -1 (negative) to 1 (positive), is less than the specified value. |
| SentimentGreaterThan | Filters interactions where the call sentiment, measured on a scale from -1 (negative) to 1 (positive), is greater than the specified value. |
The final step in creating a Notification is clicking the Review button. A page rendering the complete configuration parameters set for the Notification. An example of this is illustrated in Figure – Notification Review. The Admin user may edit any of the fields, if necessary. Once the Admin user is satisfied with the Notification’s configuration, they must click the Save button to save the newly created Notification. Should any of the Notification’s conditions be met, a Notification Event is generated and at a minimum, logged.

Figure – Notification Review
If an Admin user wishes to create a new Notification, without making use of the wizard, as described above then they would check (enable) the checkbox ‘Skip Wizard’ illustrated by 8 in Figure – Notifications, then click the New Notification button as illustrated by 4 in Figure – Notifications. This will result in the user being taken directly to the Review page in which they may enter all the Notification configuration details in one convenient view. Once they have entered all the pertinent information they would click Save to save the Notification’s configuration. An example of the ‘blank’ review page is illustrated in Figure – Notification Blank Review.
Figure – Notification Blank Review
Referring back to Figure – Notifications, there are two tablatures rendered; the Management tablature illustrated by 1 and the Activity Log tablature, illustrated by 2. We have discussed the Management tablature.
Logout
Pressing on this menu item will result in the logged in user being logged out of the CallCabinet application and being presented with CallCabinet’s login screen, as illustrated below.

Support
Should you, the user of CallCabinet, have any questions or require any form of CallCabinet support, either
- Email us at support@callcabinet.com or
- Visit our help desk by clicking here to go to https://support.callcabinet.com/hc/en-us. When a user visits this web page, they will be presented with a screen similar to that illustrated in Figure – Support Portal (Website). There are a number of links the user may click on to try and find an answer to their problem. A user may also click on the Submit a Request button, indicated by number 1 in Figure – Support Portal (Website) to submit a request for help. Clicking on this button will direct the user to the page illustrated in Figure – Submit a Request for Support. Here a user may enter a description of the problem they are facing, once done, they may submit this request for help. It is imperative that the user, submitting a request for assistance, provides an accurate and detailed description of their issue in order

Figure 1 – Support Portal (Website)
for CallCabinet to resolve their problem with minimal delay.

Figure 2 – Submit a Request for Support
Predefined Roles and Associated Permissions
The predefined roles available in CallCabinet are:
- Restricted User
- SupportUser
- Restricted Admin
- Standard User
- Admin
- Super Admin
Any of these roles may be used as the ‘root role’ when a user, with the requisite permissions, creates a custom role.
NOTE: In order to have access to certain sections, the user must also have a corresponding license. A quality assurance license grants access to the quality assurance features in CallCabinet including performing QA evaluations, running QA related reports and creating QA scorecards. This license includes three associated roles, which are preceded by QA:
- QA Supervisor
- QA Analyst
- QA Admin
- Advanced User – a value-add feature license that grants any user role access to the advanced call details page and reporting features in CallCabinet.
NOTE: A permission may depend on other permissions. In such cases, when the dependent permission is enabled, so are all its dependent permissions.
Restricted User
| Permissions On . . . | Actual Permission | License Required |
|---|---|---|
| Other | ||
| Restricted User | ||
| View QA Dashboard Page | A or B or C | |
| Advanced Reports | B or C or D | |
| Calls | ||
| Call Playback | ||
| Call Flagging | ||
| Call Listing | ||
| Call Details | ||
| Call Notes | ||
| Call Notes (point in time) | ||
| Legal Hold Support | ||
| Single Call Download | ||
| Call Bulk Download | ||
| Call Email | ||
| Call Delete | ||
| Call Sharing | ||
| Call Metadata Support | ||
| Share Extension when sharing calls | ||
| Reassign Calls at Call Details | ||
| Call Tagging | ||
| General | ||
| Share screenshot when sharing calls | ||
| Share point in time notes when sharing calls | ||
| Share transcription when sharing calls | ||
| Show completion percentage | ||
| Show Email Agent Option on QA | ||
| Share downloadable call | ||
| Share for a maximum of | ||
| Share call with permission to add note | ||
| Share general notes | ||
| Show Running Score | ||
| QA Management | ||
| Create QA Form | C | |
| Modify QA Form | C | |
| Copy QA form “Save As” | C | |
| Delete QA Form | C | |
| Perform QA Evaluations | A or B or C | |
| Email Agent on Eval | A or B or C | |
| Email manager on completed QA | A or B or C | |
| Include screenshots in QA Completed email | A or B or C | |
| Site Management | No Permissions | |
| User Management | No Permissions | |
| Restricted User Management | No Permissions | |
| Group Management | No Permissions | |
| Extension Management | No Permissions | |
| Phone Book Management | No Permissions | |
| Retention Management | No Permissions | |
| IP Whitelist | No Permissions | |
| Role Management | No Permissions | |
| QA Randomizer | No Permissions | |
| Tag Management | No Permissions | |
| Grid Management | No Permissions |
Support User
| Permissions On . . . | Actual Permission | License Required |
|---|---|---|
| Other | ||
| Client Heartbeats | ||
| View QA Dashboard Page | A or B or C | |
| Advanced Reports | B or C or D | |
| Security Audit Trail (Customer Log) | ||
| Calls | No Permissions | |
| General | ||
| Show completion percentage | ||
| Show Email Agent Option on QA | ||
| Company Date Format | ||
| Disable Classic Login | ||
| Authentication Endpoint | ||
| Share general notes | ||
| Access to Settings pages | ||
| Be Idle For | ||
| Export Date Format | ||
| Show Running Score | ||
| Notification | ||
| QA Management | ||
| Create QA Form | C | |
| Modify QA Form | C | |
| Copy QA form “Save As” | C | |
| Perform QA Evaluations | A or B or C | |
| Email Agent on Eval | A or B or C | |
| Email manager on completed QA | A or B or C | |
| Include screenshots in QA Completed email | A or B or C | |
| Site Management | ||
| Add a Site | ||
| View a Site | ||
| Update a Site | ||
| Delete a Site | ||
| User Management | ||
| View a User | ||
| Delete a User | ||
| Restricted User Management | ||
| View Agents, Groups, Sites from Restricted user access | ||
| Assign, Edit, Delete Agents from Restricted user access | ||
| Assign, Edit, Delete Groups from Restricted user access | ||
| Assign, Edit, Delete Sites from Restricted user access | ||
| Agent Management | ||
| Add new Agent | ||
| View an Agent | ||
| Update an Agent | ||
| Delete an Agent | ||
| Export Agents | ||
| Import Agents | ||
| Download Agent template | ||
| Reassign Calls | ||
| Assign Agent Extension | ||
| View Agent Extension | ||
| Delete Agent Extension | ||
| Group Management | ||
| Add a Group | ||
| View a Group | ||
| Update a Group | ||
| Delete a Group | ||
| Extension Management | ||
| Add Extension | ||
| View Extension | ||
| Update Extension | ||
| Delete Extension | ||
| Export Extension List | ||
| Import Extension List | ||
| Download Extension template | ||
| Reassign Extension | ||
| Map Extensions to Sites | ||
| Phone Book Management | ||
| Add Phone Book entry | ||
| View Phone Book entry | ||
| Update Phone Book entry | ||
| Delete Phone Book entry | ||
| Export Phone Book | ||
| Import Phone Book | ||
| Download Phone Book template | ||
| Retention Management | ||
| View Retention Profile | ||
| Update Retention Profile | ||
| IP Whitelist | ||
| Enable IP Whitelisting Control | ||
| Add new IP | ||
| View IP listing | ||
| Edit IP | ||
| Delete IP | ||
| Role Management | No Permissions | |
| QA Randomizer | ||
| QA Randomizer | ||
| Tag Management | No Permissions | |
| Grid Management | ||
| View Grid Management | ||
| Edit Grid Management |
Restricted Admin
| Permissions On . . . | Actual Permission | License Required |
|---|---|---|
| Other | ||
| Restricted User | ||
| View QA Dashboard Page | A or B or C | |
| Advanced Reports | B or C or D | |
| Analytics & Transcription | ||
| Conversation Analytics | ||
| Sentiment | ||
| Manual Transcription | ||
| Manual Summary | ||
| Calls | ||
| Call Playback | ||
| Call Flagging | ||
| Call Listing | ||
| Call Details | ||
| Call Notes | ||
| Call Notes (point in time) | ||
| Legal Hold Support | ||
| Single Call Download | ||
| Call Bulk Download | ||
| Call Email | ||
| Call Delete | ||
| Call Sharing | ||
| Call Metadata Support | ||
| Share Extension when sharing calls | ||
| Reassign Calls at Call Details | ||
| Call Tagging | ||
| General | ||
| Access to Settings pages | ||
| QA Management | ||
| Create QA Form | C | |
| Modify QA Form | C | |
| Copy QA form “Save As” | C | |
| Delete QA Form | C | |
| Perform QA Evaluations | A or B or C | |
| Email Agent on Eval | A or B or C | |
| Email manager on completed QA | A or B or C | |
| Include screenshots in QA Completed email | A or B or C | |
| Site Management | No Permissions | |
| User Management | No Permissions | |
| Restricted User Management | No Permissions | |
| Agent Management | ||
| Add new Agent | ||
| View an Agent | ||
| Update an Agent | ||
| Delete an Agent | ||
| Export Agents | ||
| Group Management | No Permissions | |
| Extension Management | ||
| Add Extension | ||
| View Extension | ||
| Update Extension | ||
| Delete Extension | ||
| Export Extension List | ||
| Import Extension List | ||
| Download Extension template | ||
| Reassign Extension | ||
| Map Extensions to Sites | ||
| Phone Book Management | No Permissions | |
| Retention Management | No Permissions | |
| IP Whitelist | No Permissions | |
| Role Management | No Permissions | |
| QA Randomizer | No Permissions | |
| Tag Management | ||
| Add a Tag | ||
| View a Tag | ||
| Update a Tag | ||
| Delete a Tag | ||
| Grid Management | No Permissions |
Standard User
Grants users’ access to the Call Listing page for call playback and filtering.
| Permissions On . . . | Actual Permission | License Required |
|---|---|---|
| Other | ||
| View Calls Dashboard page for all Sites / Users | ||
| View QA Dashboard Page | A or B or C | |
| Advanced Reports | B or C or D | |
| Analytics & Transcription | ||
| Conversation Analytics | ||
| Sentiment | ||
| Manual Transcription | ||
| Manual Summary | ||
| Calls | ||
| Call Playback | ||
| Call Flagging | ||
| Call Listing | ||
| Call Details | ||
| Call Notes | ||
| Call Notes (point in time) | ||
| Legal Hold Support | ||
| Single Call Download | ||
| Call Bulk Download | ||
| Call Email | ||
| Call Delete | ||
| Call Sharing | ||
| Call Metadata Support | ||
| Reassign Calls at Call Details | ||
| General | No Permissions | |
| QA Management | ||
| Create QA Form | C | |
| Modify QA Form | C | |
| Copy QA form “Save As” | C | |
| Delete QA Form | C | |
| Perform QA Evaluations | A or B or C | |
| Email Agent on Eval | A or B or C | |
| Email manager on completed QA | A or B or C | |
| Include screenshots in QA Completed email | A or B or C | |
| Site Management | No Permissions | |
| User Management | No Permissions | |
| Restricted User Management | No Permissions | |
| Agent Management | No Permissions | |
| Group Management | No Permissions | |
| Extension Management | No Permissions | |
| Phone Book Management | No Permissions | |
| Retention Management | No Permissions | |
| IP Whitelist | No Permissions | |
| Role Management | No Permissions | |
| QA Randomizer | No Permissions | |
| Tag Management | No Permissions | |
| Grid Management | No Permissions |
Admin
Grants users’ access to the Call Listing page and some system settings including user- and agent management. This role is typically assigned to a manager, supervisor or IT professional who is responsible for maintaining some overall system settings in CallCabinet.
| Permissions On . . . | Actual Permission | License Required |
|---|---|---|
| Other | ||
| View Calls Dashboard page for all Sites / Users | ||
| Client Heartbeats | ||
| View QA Dashboard Page | A or B or C | |
| Advanced Reports | B or C or D | |
| Security Audit Trail (Customer Log) | ||
| Analytics Transcription | ||
| Conversation Analytics | ||
| Sentiment | ||
| Manual Transcription | ||
| Manual Summary | ||
| Calls | ||
| Call Playback | ||
| Call Flagging | ||
| Call Listing | ||
| Call Details | ||
| Call Notes | ||
| Call Notes (point in time) | ||
| Legal Hold Support | ||
| Single Call Download | ||
| Call Bulk Download | ||
| Call Email | ||
| Call Delete | ||
| Call Sharing | ||
| Call Metadata Support | ||
| Share Extension when sharing calls | ||
| Reassign Calls at Call Details | ||
| Call Tagging | ||
| General | ||
| Share screenshot when sharing calls | ||
| Share point in time notes when sharing calls | ||
| Share transcription when sharing calls | ||
| Show completion percentage | ||
| Show Email Agent Option on QA | ||
| Company Date Format | ||
| Disable Classic Login | ||
| Authentication Endpoint | ||
| Send Weekly Email | ||
| Include call download name in excel export | ||
| Share downloadable call | ||
| Share for a maximum of | ||
| Share call with permission to add note | ||
| Share general notes | ||
| Access to Settings pages | ||
| Be Idle For | ||
| Export Date Format | ||
| Show Running Score | ||
| Notification | ||
| QA Management | ||
| Create QA Form | C | |
| Modify QA Form | C | |
| Copy QA form “Save As” | C | |
| Delete QA Form | C | |
| Perform QA Evaluations | A or B or C | |
| Email Agent on Eval | A or B or C | |
| Email manager on completed QA | A or B or C | |
| Include screenshots in QA Completed email | A or B or C | |
| Site Management | ||
| Add a Site | ||
| View a Site | ||
| Update a Site | ||
| Delete a Site | ||
| User Management | ||
| Add a User | ||
| View a User | ||
| Update a User | ||
| Delete a User | ||
| The right to accept or reject Access Requests | ||
| Import Users | ||
| Export Users | ||
| Download User template | ||
| Restricted User Management | ||
| View Agents, Groups, Sites from Restricted user access | ||
| Assign, Edit, Delete Agents from Restricted user access | ||
| Assign, Edit, Delete Groups from Restricted user access | ||
| Assign, Edit, Delete Sites from Restricted user access | ||
| Agent Management | ||
| Add new Agent | ||
| View an Agent | ||
| Update an Agent | ||
| Delete an Agent | ||
| Export Agents | ||
| Import Agents | ||
| Download Agent template | ||
| Reassign Calls | ||
| Assign Agent Extension | ||
| View Agent Extension | ||
| Delete Agent Extension | ||
| Group Management | ||
| Add a Group | ||
| View a Group | ||
| Update a Group | ||
| Delete a Group | ||
| Extension Management | ||
| Add Extension | ||
| View Extension | ||
| Update Extension | ||
| Delete Extension | ||
| Export Extension List | ||
| Import Extension List | ||
| Download Extension template | ||
| Reassign Extension | ||
| Map Extensions to Sites | ||
| Phone Book Management | ||
| Add Phone Book entry | ||
| View Phone Book entry | ||
| Update Phone Book entry | ||
| Delete Phone Book entry | ||
| Export Phone Book | ||
| Import Phone Book | ||
| Download Phone Book template | ||
| Retention Management | ||
| View Retention Profile | ||
| Update Retention Profile | ||
| IP Whitelist | No Permissions | |
| Role Management | ||
| Add a Role | ||
| Update a Role | ||
| Delete a Role | ||
| QA Randomizer | ||
| QA Randomizer | ||
| Tag Management | ||
| Add a Tag | ||
| View a Tag | ||
| Update a Tag | ||
| Delete a Tag | ||
| Grid Management | ||
| View Grid Management | ||
| Edit Grid Management |
Super Admin
Grants access to all the system settings in CallCabinet and is the highest role that can be assigned.
| Permission On | Permission | License Required |
|---|---|---|
| Other | ||
| View Calls Dashboard page for all Sites / Users | ||
| Client Heartbeats | ||
| View QA Dashboard Page | A or B or C | |
| Advanced Reports | B or C or D | |
| Security Audit Trail (Customer Log) | ||
| Analytics & Transcription | ||
| Conversation Analytics | ||
| Sentiment | ||
| Manual Transcription | ||
| Manual Summary | ||
| Calls | ||
| Call Playback | ||
| Call Flagging | ||
| Call Listing | ||
| Call Details | ||
| Call Notes | ||
| Call Notes (point in time) | ||
| Legal Hold Support | ||
| Single Call Download | ||
| Call Bulk Download | ||
| Call Email | ||
| Call Delete | ||
| Call Sharing | ||
| Call Metadata Support | ||
| Share Extension when sharing calls | ||
| Reassign Calls at Call Details | ||
| Call Tagging | ||
| General | ||
| Share screenshot when sharing calls | ||
| Share point in time notes when sharing calls | ||
| Share transcription when sharing calls | ||
| Show completion percentage | ||
| Show Email Agent Option on QA | ||
| Company Date Format | ||
| Disable Classic Login | ||
| Authentication Endpoint | ||
| Send Weekly Email | ||
| Include call download name in excel export | ||
| Share downloadable call | ||
| Share for a maximum of | ||
| Share call with permission to add note | ||
| Share general notes | ||
| Access to Settings pages | ||
| Be Idle For | ||
| Export Date Format | ||
| Show Running Score | ||
| Notification | ||
| QA Management | ||
| Create QA Form | C | |
| Modify QA Form | C | |
| Copy QA form “Save As” | C | |
| Delete QA Form | C | |
| Perform QA Evaluations | A or B or C | |
| Email Agent on Eval | A or B or C | |
| Email manager on completed QA | A or B or C | |
| Include screenshots in QA Completed email | A or B or C | |
| Site Management | ||
| Add a Site | ||
| View a Site | ||
| Update a Site | ||
| Delete a Site | ||
| User Management | ||
| Add a User | ||
| Add Users with Super Admin Role | ||
| View a User | ||
| Update a User | ||
| Update Users with Super Admin Role | ||
| Delete a User | ||
| Delete Users with Super Admin Role | ||
| The right to accept or reject Access Requests | ||
| Import Users | ||
| Export Users | ||
| Download User template | ||
| Update User License | ||
| Restricted User Management | ||
| View Agents, Groups, Sites from Restricted user access | ||
| Assign, Edit, Delete Agents from Restricted user access | ||
| Assign, Edit, Delete Groups from Restricted user access | ||
| Assign, Edit, Delete Sites from Restricted user access | ||
| Agent Management | ||
| Add new Agent | ||
| View an Agent | ||
| Update an Agent | ||
| Delete an Agent | ||
| Export Agents | ||
| Import Agents | ||
| Download Agent template | ||
| Reassign Calls | ||
| Assign Agent Extension | ||
| View Agent Extension | ||
| Delete Agent Extension | ||
| Group Management | ||
| Add a Group | ||
| View a Group | ||
| Update a Group | ||
| Delete a Group | ||
| Extension Management | ||
| Add Extension | ||
| View Extension | ||
| Update Extension | ||
| Delete Extension | ||
| Export Extension List | ||
| Import Extension List | ||
| Download Extension template | ||
| Reassign Extension | ||
| Map Extensions to Sites | ||
| Phone Book Management | ||
| Add Phone Book entry | ||
| View Phone Book entry | ||
| Update Phone Book entry | ||
| Delete Phone Book entry | ||
| Export Phone Book | ||
| Import Phone Book | ||
| Download Phone Book template | ||
| Retention Management | ||
| View Retention Profile | ||
| Update Retention Profile | ||
| IP Whitelist | ||
| Enable IP Whitelisting Control | ||
| Add new IP | ||
| View IP listing | ||
| Edit IP | ||
| Delete IP | ||
| Role Management | ||
| Add a Role | ||
| Update a Role | ||
| Delete a Role | ||
| QA Randomizer | ||
| QA Randomizer | ||
| Tag Management | ||
| Add a Tag | ||
| View a Tag | ||
| Update a Tag | ||
| Delete a Tag | ||
| Grid Management | ||
| View Grid Management | ||
| Edit Grid Management |
Glossary
| Agent | Individuals whose calls are being recorded by CallCabinet. |
| Agent Client Desktop Application | This application gets installed directly on an agent’s desktop. It allows an agent to perform manual redaction of information from a call while on a live call. The application is also able to record screenshots of the agent’s desktop while they are on a call, and allows the agent to add a note or a reference to a live call recording. |
| Agent License | This is a license that is assigned specifically to an agent (see above) such as recording licenses, screenshot licenses and manual PCI DSS redaction licenses. |
| Audio Oscillogram | A visual representation of the audio recording. |
| Audit Log | Found on the Call Details Page, this log file details which users have interacted with each call recording and when. It will display which user used the playback feature, shared the call, if a share was accessed, performed a QA or downloaded the call. An access log keeps a record of every action performed on a specific call in the system. |
| CallCabinet Agent Client | This is installed directly on the agent’s desktop. This application allows an agent to manually begin a compliance interval, add a note, or add a reference number to a live call. The application is also responsible for recording screenshots of the agent’s desktop whilst on a call. |
| Call Tags | Information or data that uniquely identifies the call. Call tags in CallCabinet are completely customizable to suit the business needs. |
| Compliance call recording | Refers to making a digital copy of the conversation that occurs via telephone or Internet in line with industry and/or country-specific regulations. It can contain audio and/or video which can only be created, accessed, viewed, modified or deleted according to predetermined permissions, laws and regulations. This digital copy is also referred to as the recording data and is what makes a business using CallCabinet compliant. |
| Customer | User of CallCabinet |
| Distributor | A distributor is someone or something that distributes a product or service, such as a wholesaler or a retailer |
| Excel | A spreadsheet editor developed by Microsoft |
| Filter | Means to add criteria to a user’s search (adding filters) on the Call Listing page that will assist them in narrowing down the returned results. For instance, selecting specific agents and time periods. |
| IP-PBX | IP PBX is a business phone system that uses VoIP technology to connect internal and external calls using the TCP/IP protocol stack. |
| Legal hold | Refers to keeping a specific call recording on file (preventing it from being deleted) due to a dispute that may be in progress. |
| Multi-Function Authentication (MFA) | Multi-factor authentication (MFA; two-factor authentication, or 2FA, is an electronic authentication method in which a user is granted access to a website or application only after successfully presenting two or more pieces of evidence to an authentication mechanism. |
| Multi-tenant/ Multi-tenancy | In multi-tenant software architecture, also called software multi-tenancy, a single instance of a software application (and its underlying database and hardware) serves multiple tenants (or user accounts). A tenant may be an individual user, but more frequently, it is a group of users, such as a customer organization, which share common access to and privileges within the application instance. Each tenant’s data is isolated from, and invisible to, the other tenants sharing the application instance, ensuring data security and privacy for all tenants.
CallCabinet is a compliance call recording solution that offers true multi-tenancy. |
| Network switch | A network switch is networking hardware that connects devices on a computer network by using packet switching to receive and forward data to the destination device |
| One-time PIN (OTP) | An automatically generated security key or password that is valid for one login session only. |
| PBX | PBX stands for Private Branch Exchange System, which is a private telephone network used within a company |
| PCI DSS | Payment card industry data security standard |
| PCI DSS Redaction | Refers to the permanent masking/protection of sensitive data, where only administrators are able to unmask and view the actual data upon request by court order. |
| Portal | A website or web page providing access or links to other sites. |
| Quality Assurance | A term used in service industries to describe the systematic efforts taken to assure that the product(s) delivered to customer(s) meet agreed upon performance expectations of that customer. QA features allow businesses to evaluate the quality-of-service performance of their agents. |
| Randomizer | Pick several items randomly out of a list. |
| Reseller | A reseller is a company or individual that purchases goods or services with the intention of selling them rather than consuming or using them. |
| Retention Policy | A framework that outlines how to manage records of different types and lengths |
| Roles | A set of connected behaviors or rights, |
| Site | Refers to a specific geographic location, the business “Site” where calls are being recorded. These locations could be within the same country (regional sites) or across countries (international sites). |
| SSO | Single sign-on is an authentication scheme that allows a user to log in with a single ID to any of several related, yet independent, software systems. |
| SSO Federation Login | The Federated Web Single-Sign-On (SSO) design in Active Directory Federation Services (AD FS) involves secure communication that spans multiple firewalls, perimeter networks, and name-resolution servers—in addition to the entire Internet routing infrastructure. |
| Tag | A label attached to something for the purpose of identification or to give other information |
| Two-Factor Authentication (2FA) | This refers to when a user is required to provide two forms of identification before they are allowed login access to a CallCabinet solution. For example, a username and password combination will be the first authentication followed by a One-time PIN as the second authentication. The One-time PIN is sent to the email address associated with the user’s account. |
| UC | Unified communications (UC) solutions deliver integration of tools such as IP telephony for voice calling, web and video conferencing, voice mail, mobility, desktop sharing, instant messaging and presence, and more, with seamless user experiences to help people work together more effectively. |
| URL | A Uniform Resource Locator (URL), colloquially known as an address on the Web is a reference to a resource that specifies its location on a computer network and a mechanism for retrieving it |
| User | A person that is able to login into a CallCabinet solution and listen to call recordings. |
| User Role | A role is assigned to a user depending on the level of access required. For example, an admin user role has access to the system’s settings, while a standard user role can only access the Call Listing page for call playback and filtering. |
| Voice Analytics | CallCabinet’s ability to scan through recordings according to preset criteria. Businesses may, for instance, use this data to determine whether their customers are satisfied with the service being rendered. |
| Video Recording | A recording of both the audible and visual components of a conversation. |
| Voice over Internet Protocol (VoIP) (Voice over IP) (IP telephony) | A group of technologies for the delivery of voice communications and multimedia sessions over internet protocol (IP) networks, such as the Internet. |
| WhiteList | A list of IP addresses given system access. Whatever is not on the list is blocked. |